

Question: For R Chart Upper Control Limit (UCL) D4.k 2.11(0.228) 0.48 :ower Control Limit (LCL) D3.k 0(0.228) Control Line (CL) 0.228

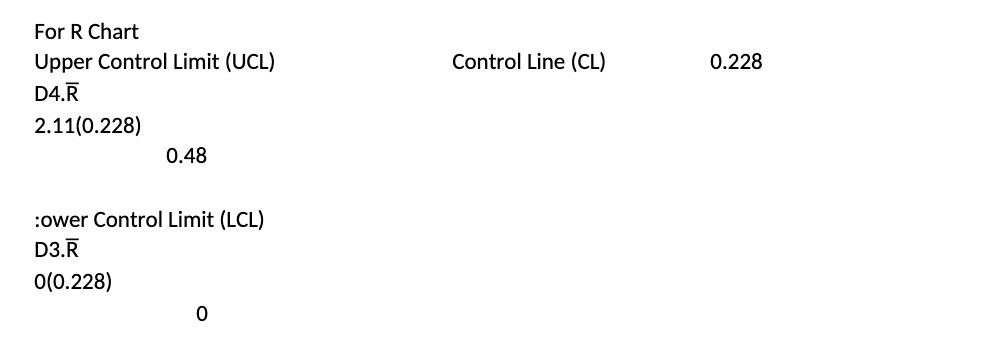
For R Chart Upper Control Limit (UCL) D4.k 2.11(0.228) 0.48 :ower Control Limit (LCL) D3.k 0(0.228) Control Line (CL) 0.228
Step by Step Solution
There are 3 Steps involved in it
1 Expert Approved Answer
Step: 1 Unlock

Question Has Been Solved by an Expert!
Get step-by-step solutions from verified subject matter experts
Step: 2 Unlock
Step: 3 Unlock