

Question: 5. The following figure is a cumulative relative frequency graph ofthe amount spent by a sample of 50 grocery shoppers at a store a)
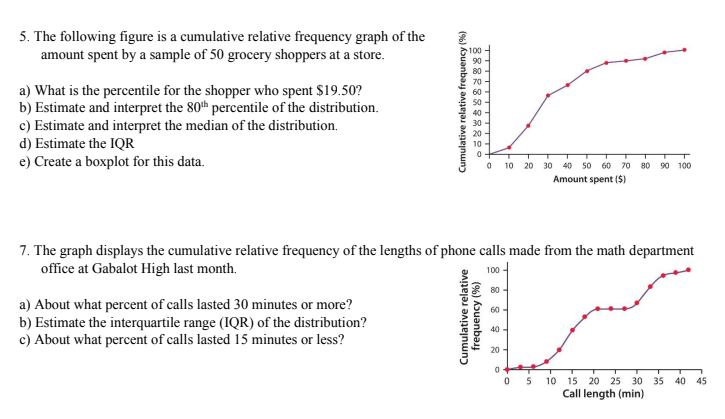

5. The following figure is a cumulative relative frequency graph ofthe amount spent by a sample of 50 grocery shoppers at a store a) What is the percentile for the shopper who spent Sl 9.50? b) Estimate and interpret the 801b percentile of the distribution. c) Estimate and interpret the median of the distribution. d) Estimate the IQR e) Create a boxplot for this data. '0 20 30 SO 80 Amount spent IS) 7. The graph displays the cumulative relative frequency of the lengths of phone calls made from the math department office at Gabalot High last month. a) About what percent of calls lasted 30 minutes or more? b) Estimate the interquartile range (IQR) of the distribution? c) About what percent of calls lasted 15 minutes or less? 80 10 IS 20 2S 30 3S 40 45 Call length (min)
Step by Step Solution
There are 3 Steps involved in it

Get step-by-step solutions from verified subject matter experts