

Question: Graph to be used with Question 11 10 10 MC ATC 50 20 30 40 Output per day
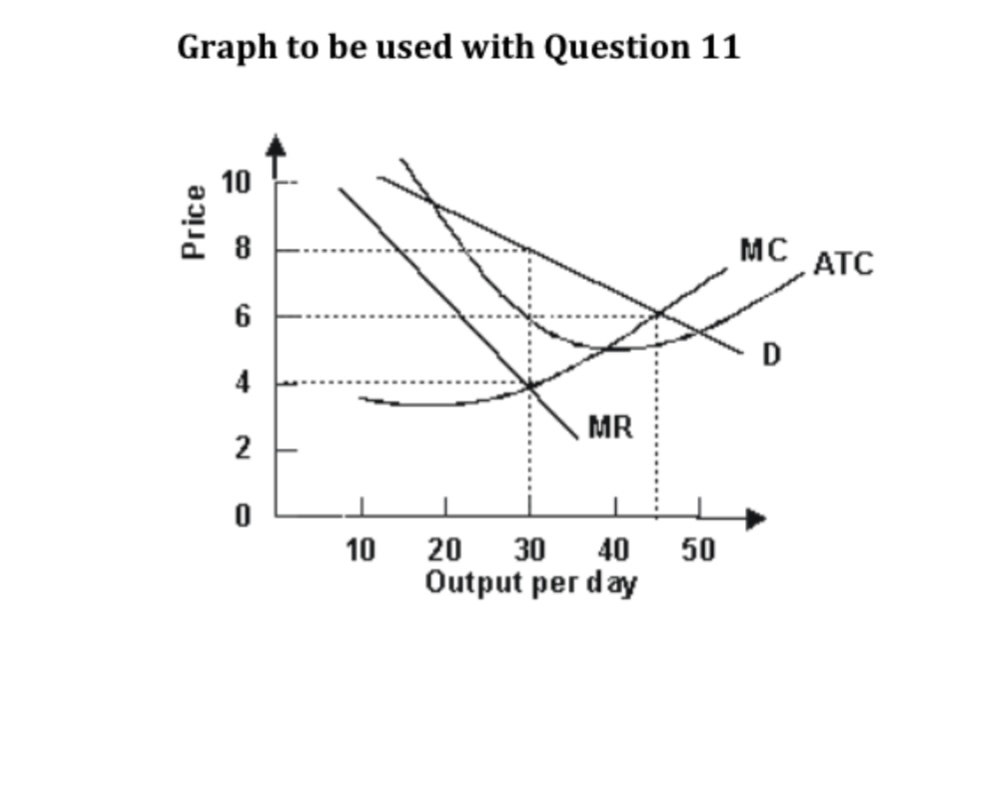

Graph to be used with Question 11 10 10 MC ATC 50 20 30 40 Output per day
Step by Step Solution
There are 3 Steps involved in it
1 Expert Approved Answer
Step: 1 Unlock

Question Has Been Solved by an Expert!
Get step-by-step solutions from verified subject matter experts
Step: 2 Unlock
Step: 3 Unlock