

Question: Consider the graph below, where the full-employment level of output is $500 billion and this is the equilibrium level of aggregate expenditure for curve

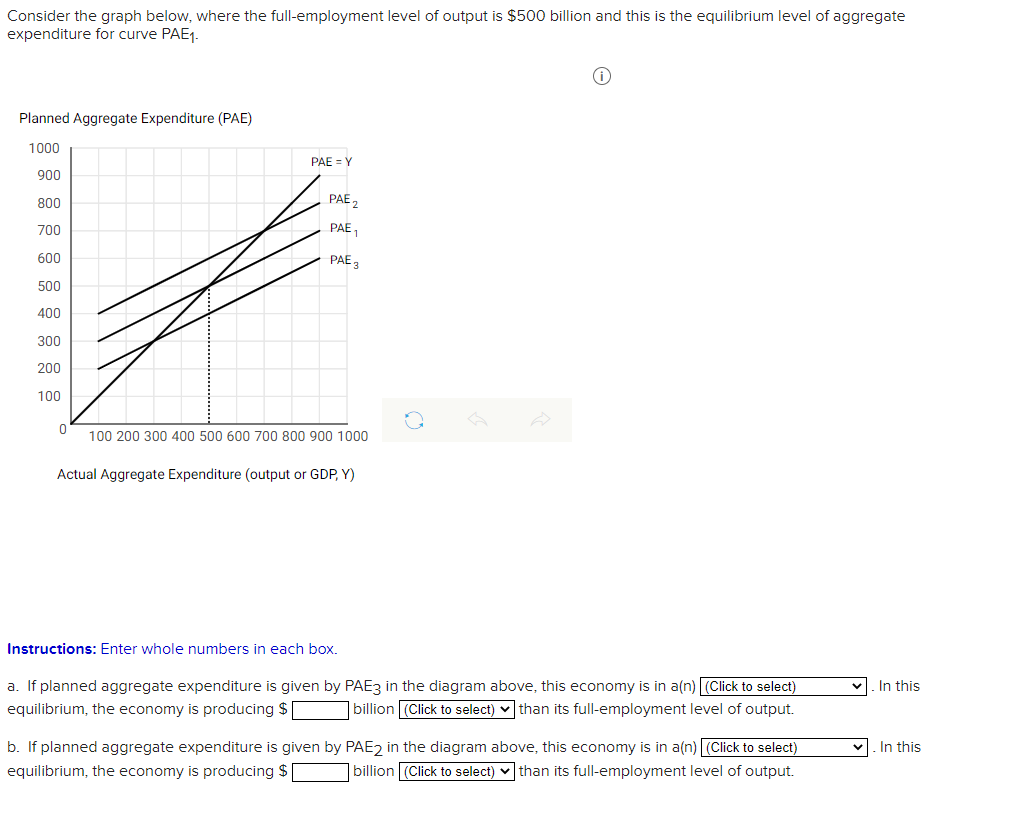
Consider the graph below, where the full-employment level of output is $500 billion and this is the equilibrium level of aggregate expenditure for curve PAEI_ Planned Aggregate Expenditure (PAE) 1000 PAE-Y goo 800 700 600 500 400 300 200 100 100 200 300 400 500 600 700 800 goo 1000 Actual Aggregate Expenditure (output or GDP, Y) Instructions: Enter whole numbers in each box. a. If planned aggregate expenditure is given by PAE3 in the diagram above, this economy is in a(n) (Click to select) equilibrium, the economy is producing S billion (Click to select) v than its full-employment level of output. b. If planned aggregate expenditure is given by PAE2 in the diagram above, this economy is in a(n) (Click to select) equilibrium, the economy is producing S billion (Click to select) v than its full-employment level of output. In this In this
Step by Step Solution
There are 3 Steps involved in it

Get step-by-step solutions from verified subject matter experts