

Question: omework Submitted The figure below shows a consumer maximizing utility at two different prices (the left panel) and the consumer's demand for good X

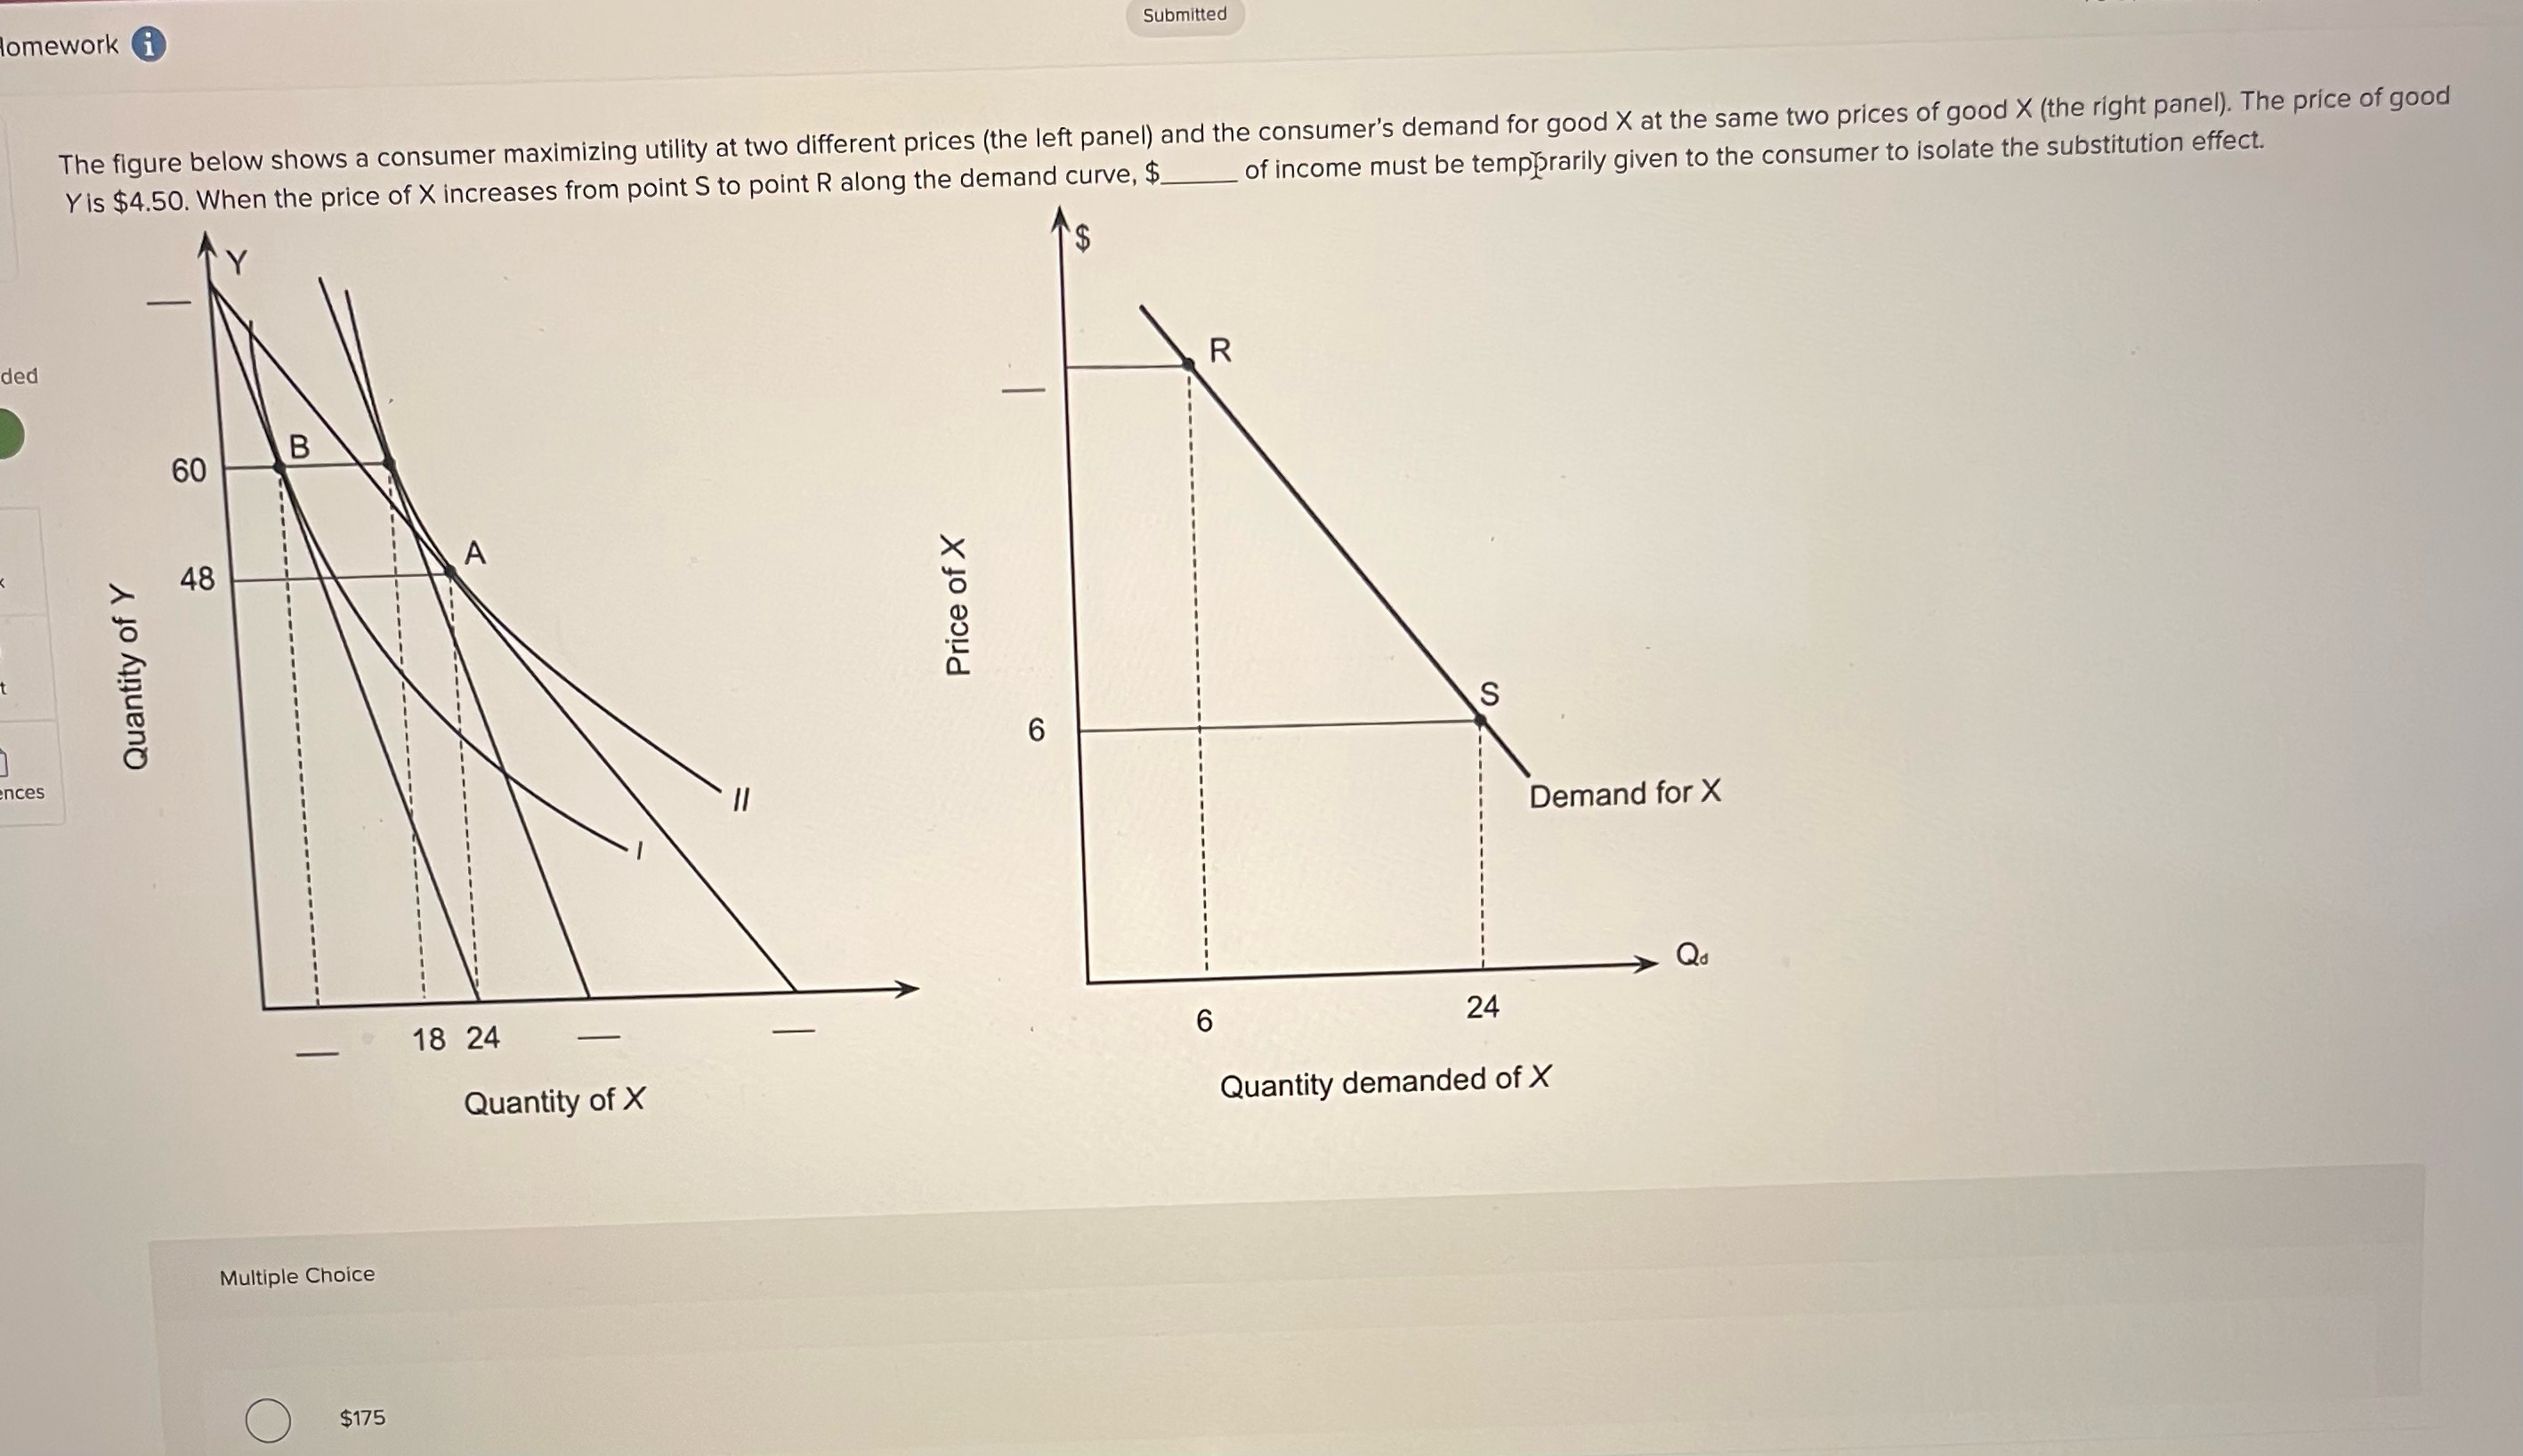
omework Submitted The figure below shows a consumer maximizing utility at two different prices (the left panel) and the consumer's demand for good X at the same two prices of good X (the right panel). The price of good Yis $4.50. When the price of X increases from point S to point R along the demand curve, $ ded 60 48 nces 11 18 24 Quantity of X Multiple Choice $175 of income must be tempprarily given to the consumer to isolate the substitution effect. Demand for X 24 Quantity demanded of X
Step by Step Solution
There are 3 Steps involved in it
1 Expert Approved Answer
Step: 1 Unlock

Question Has Been Solved by an Expert!
Get step-by-step solutions from verified subject matter experts
Step: 2 Unlock
Step: 3 Unlock