

Question: Please help The figure below shows a consumer maximizing utility at two different prices (the left panel) and the consumer's demand for good X at

Please help
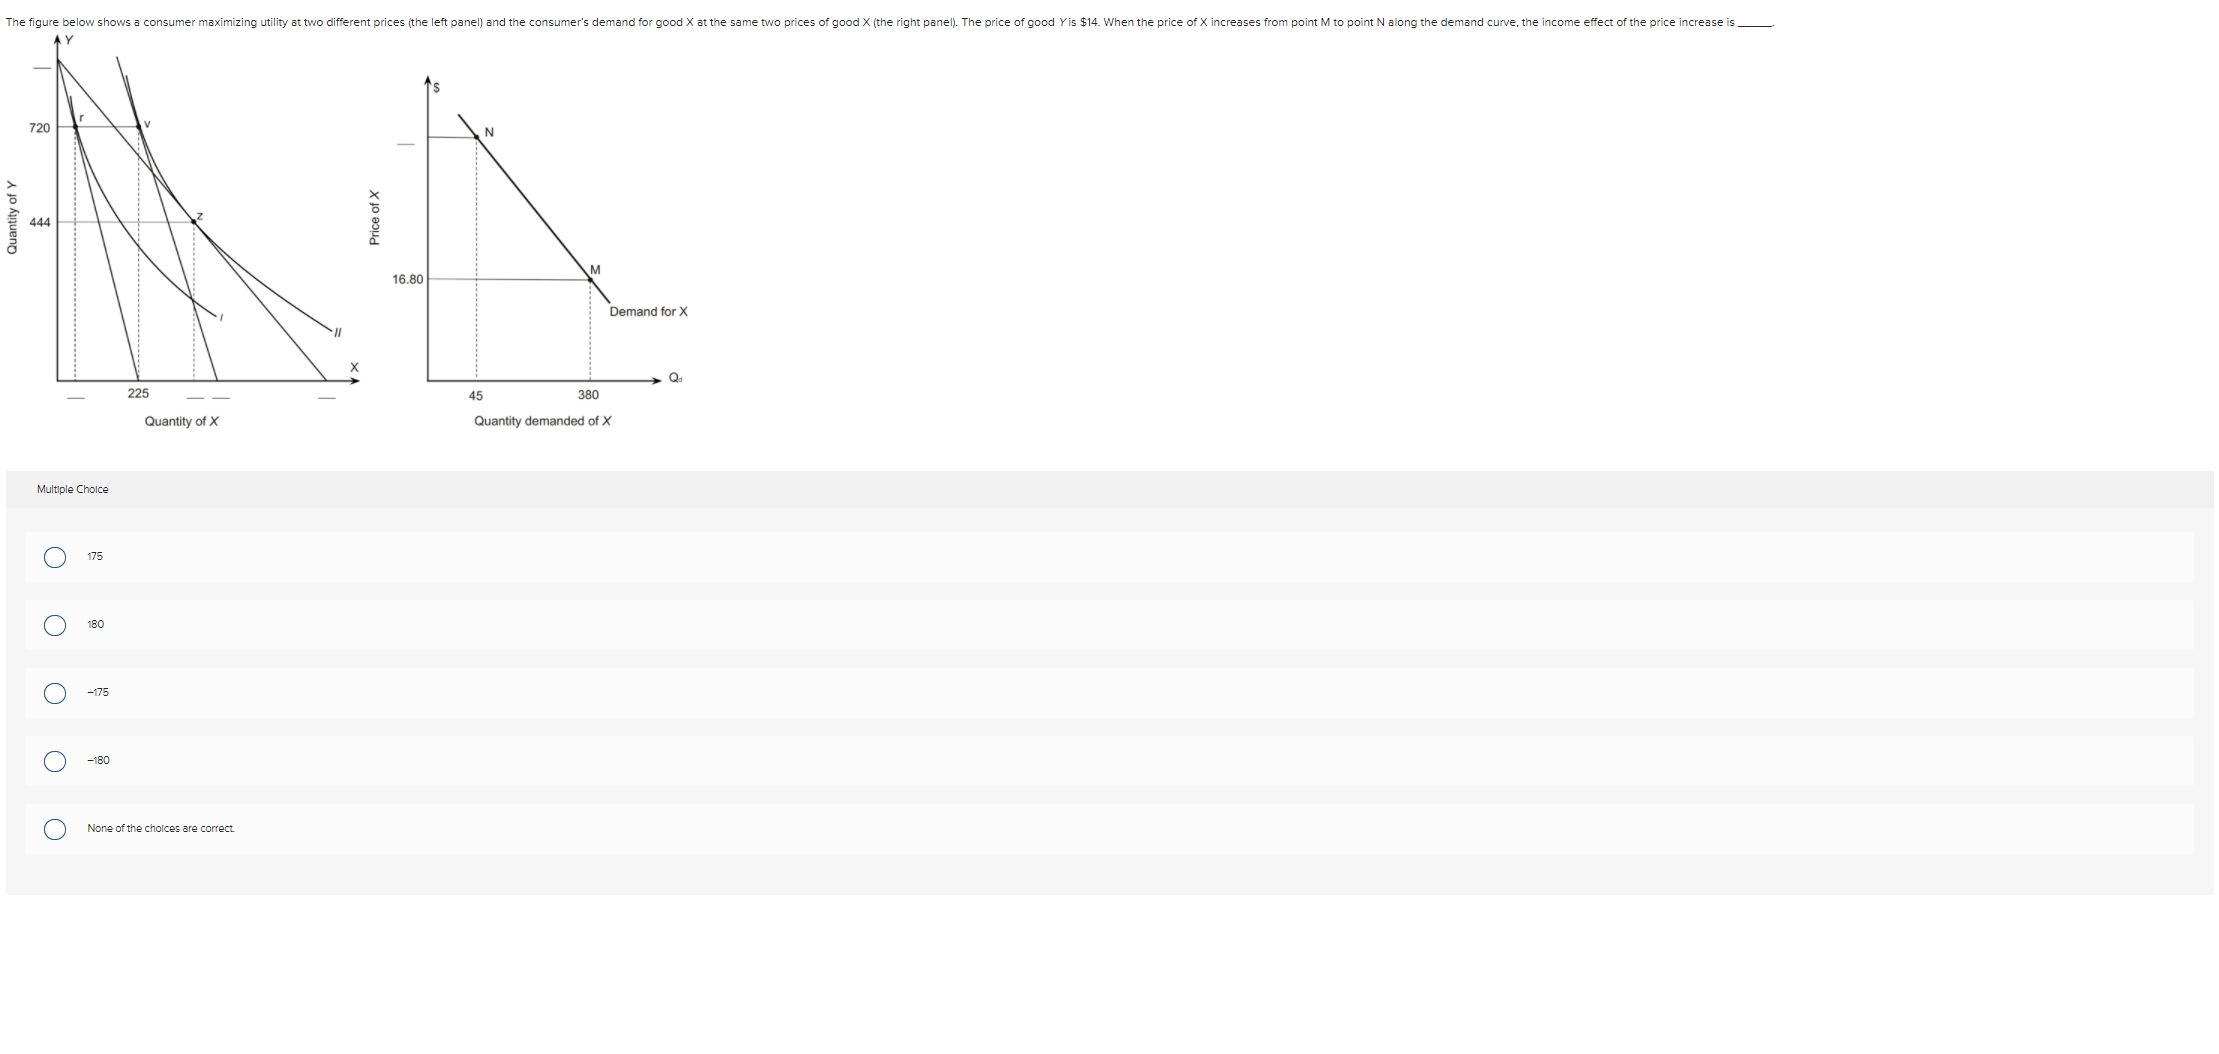
The figure below shows a consumer maximizing utility at two different prices (the left panel) and the consumer's demand for good X at the same two prices of good X (the right panel). The price of good Yis $14. When the price of X increases from point M to point N along the demand curve, the income effect of the price increase is_ AY 720 Quantity of Y 444 Price of X 16.80 M Demand for X 225 45 380 Quantity of X Quantity demanded of X Multiple Choice O 175 O 180 O -175 O -180 O None of the choices are correct
Step by Step Solution
There are 3 Steps involved in it
1 Expert Approved Answer
Step: 1 Unlock

Question Has Been Solved by an Expert!
Get step-by-step solutions from verified subject matter experts
Step: 2 Unlock
Step: 3 Unlock