

Question: The following chart shows an oligopoly market where the firms act together to maximise profit. 50 40 30 20 10 15 In this chart,

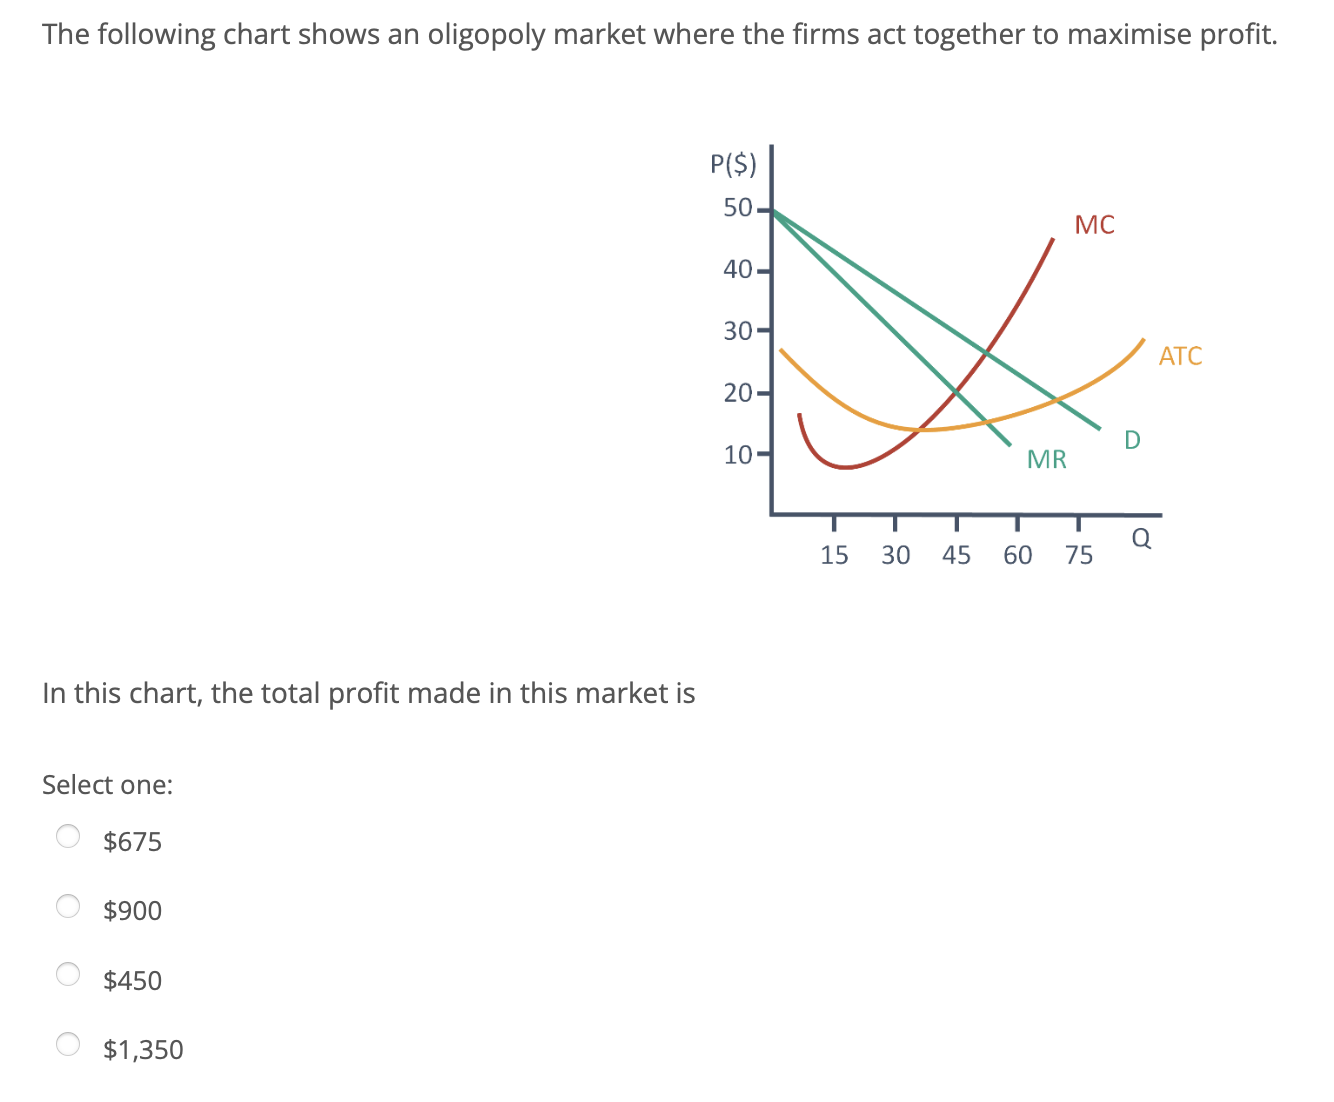
The following chart shows an oligopoly market where the firms act together to maximise profit. 50 40 30 20 10 15 In this chart, the total profit made in this market is Select one: O $675 O $900 $450 O $1 ,350 30 45 MC ATC 60 75
Step by Step Solution
There are 3 Steps involved in it
1 Expert Approved Answer
Step: 1 Unlock

Question Has Been Solved by an Expert!
Get step-by-step solutions from verified subject matter experts
Step: 2 Unlock
Step: 3 Unlock