

Question: . Draw the graph of y = logzx. Fill in the t-chart with at least 3 points, after converting to exponential form. Choose an

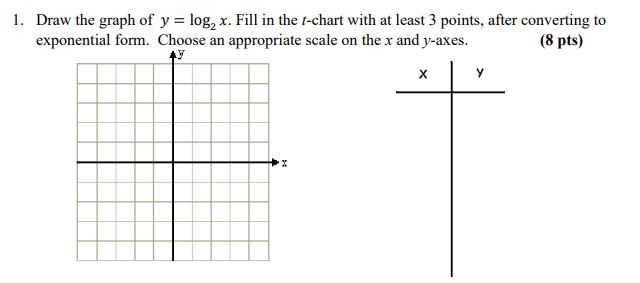
. Draw the graph of y = logzx. Fill in the t-chart with at least 3 points, after converting to exponential form. Choose an appropriate scale on the x and y-axes. (8 pts)
Step by Step Solution
There are 3 Steps involved in it
1 Expert Approved Answer
Step: 1 Unlock

Question Has Been Solved by an Expert!
Get step-by-step solutions from verified subject matter experts
Step: 2 Unlock
Step: 3 Unlock