

Question: Helllo please I need help World population Below is a table with estimates of world population since 1AD. Population growth can often be modeled as
Helllo please I need help World population
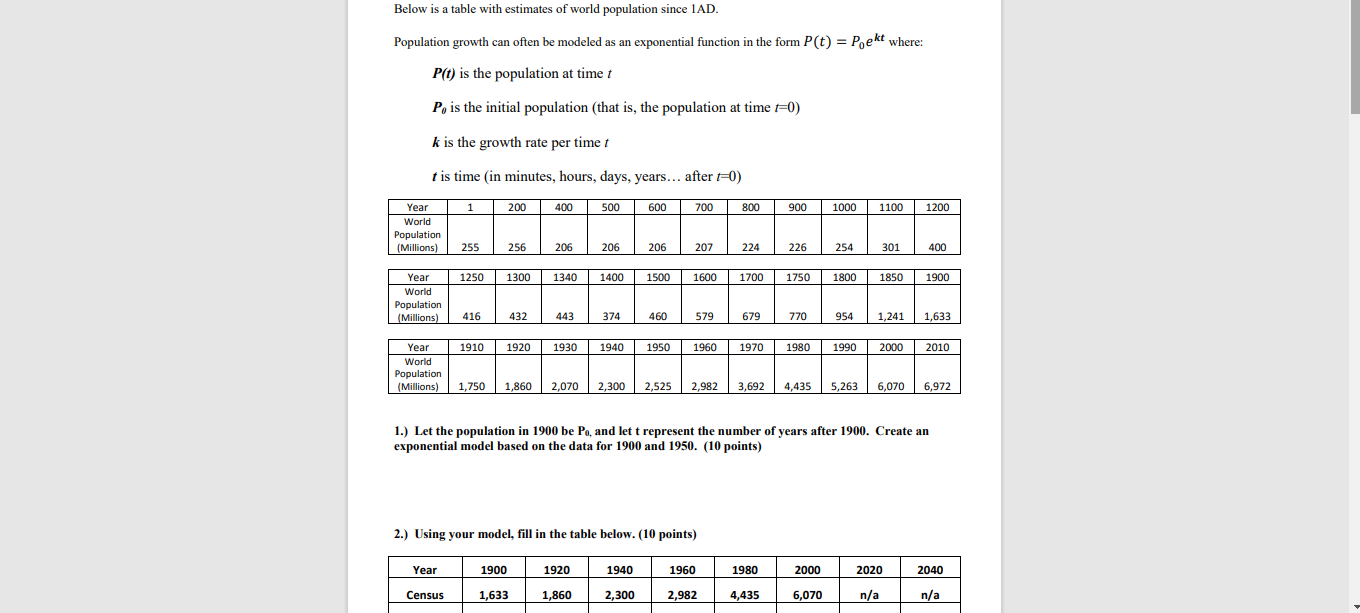
Below is a table with estimates of world population since 1AD. Population growth can often be modeled as an exponential function in the form P(t) = Poekt where: P(1) is the population at time Po is the initial population (that is, the population at time =0) k is the growth rate per time t is time (in minutes, hours, days, years... after =0) Year 1 200 400 500 600 700 800 900 World 1000 1100 1200 Population (Millions) 255 256 206 206 206 207 224 226 254 301 400 Year 1250 1300 1340 1400 1500 1600 1700 1750 1800 1850 1900 World Population (Millions) $16 432 443 374 460 579 679 770 954 1,241 1,633 Year 1910 1920 1930 1940 1950 1960 1970 World 1980 1990 2000 2010 Population (Millions) 1,750 1,860 2,070 2,300 2,525 2,982 3,692 4,435 5,263 6,070 6,972 1.) Let the population in 1900 be Po, and let t represent the number of years after 1900. Create an exponential model based on the data for 1900 and 1950. (10 points) 2.) Using your model, fill in the table below. (10 points) Year 1900 1920 1940 1960 1980 2000 2020 2040 Census 1,633 1,860 2,300 2,982 4,435 6,070 n/a n/a3.) The horizontal axis is labeled for you. Choose an appropriate scale for the vertical axis and graph your data from the table. Be sure to label which is the census data, and which is the model. (10 points) Population (millions) 1910 1920 1930 1940 1950 1960 1970 1980 1990 2000 2010 2020 2030 2040 4.) According to your model, in what year will the population reach 10 billion people? Lets create a second model using different years for data points. 5.) Let the population in 1950 be Po, and let t represent the number of years after 1950. Create an exponential model based on the data for 1950 and 2000. (10 points)Course Hero X CODE WA 7 World Population.pdf X + X File | C:/Users/malak/Downloads/WA%207%20World%20Population.pdf G 3 of 4 + | A) Read aloud | Draw V Highlight V Erase 7.) The horizontal axis is labeled for you. Choose an appropriate scale for the vertical axis and graph your data from the table. Be sure to label which is the census data, and which is the model. (10 points) APopulation (millions) 1910 1920 1930 1940 1950 1960 1970 1980 1990 2000 2010 2020 2030 2040 8.) According to this model, in what year will the population reach 10 billion people? (10 points) 9.) Which model (the one based on 1900-1950 or the one based on 1950-2000) is better? (10 points) Type here to search O L 9 W 10:25 AM A D 11/10/2020
Step by Step Solution
There are 3 Steps involved in it

Get step-by-step solutions from verified subject matter experts