

Question: Jse a scatter plot to display the data shown in the table available below. The data represent the numbers of hours worked and the

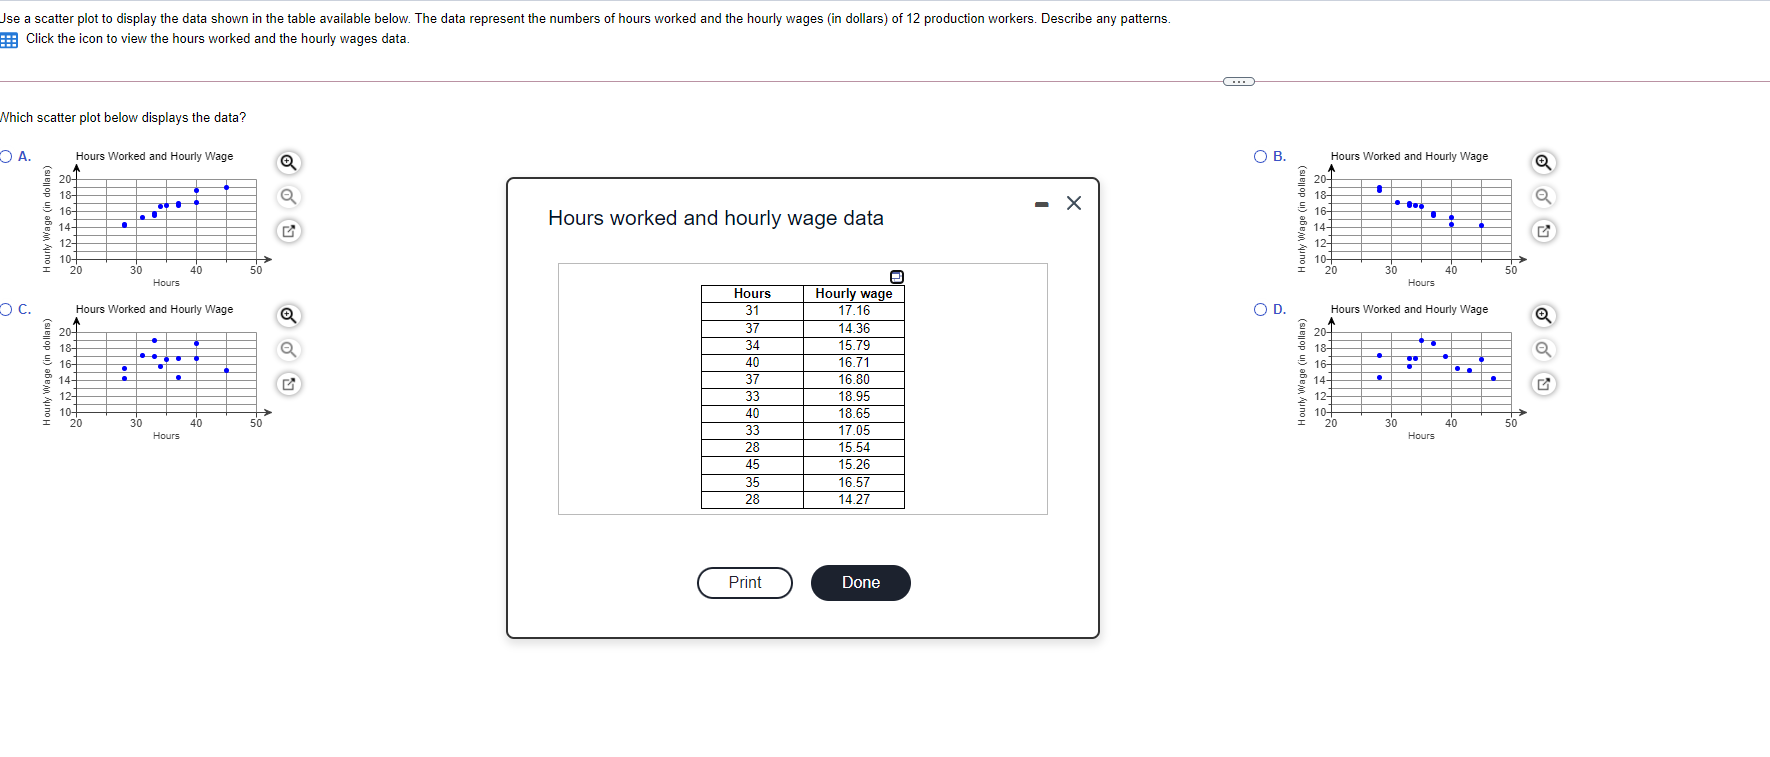
Jse a scatter plot to display the data shown in the table available below. The data represent the numbers of hours worked and the hourly wages (in dollars) of 12 production workers Describe any patterns. Click the icon to view the hours worked and the hourly wages date Nhich scatter plot below displays the data? Hours Worked and Hourly Wage Hours Worked and Hourly Wage Hours worked and hourly wage data Hours Worked and Hourly Wage Hours Worked and Hourly Wage Hours 31 37 34 40 37 33 40 33 28 45 35 28 print o Hourly wage 17
Step by Step Solution
There are 3 Steps involved in it
1 Expert Approved Answer
Step: 1 Unlock

Question Has Been Solved by an Expert!
Get step-by-step solutions from verified subject matter experts
Step: 2 Unlock
Step: 3 Unlock