

Question: the money market in the United States and the investment curve are as shown in the two graphs below. Money Market Investment Demand Curve

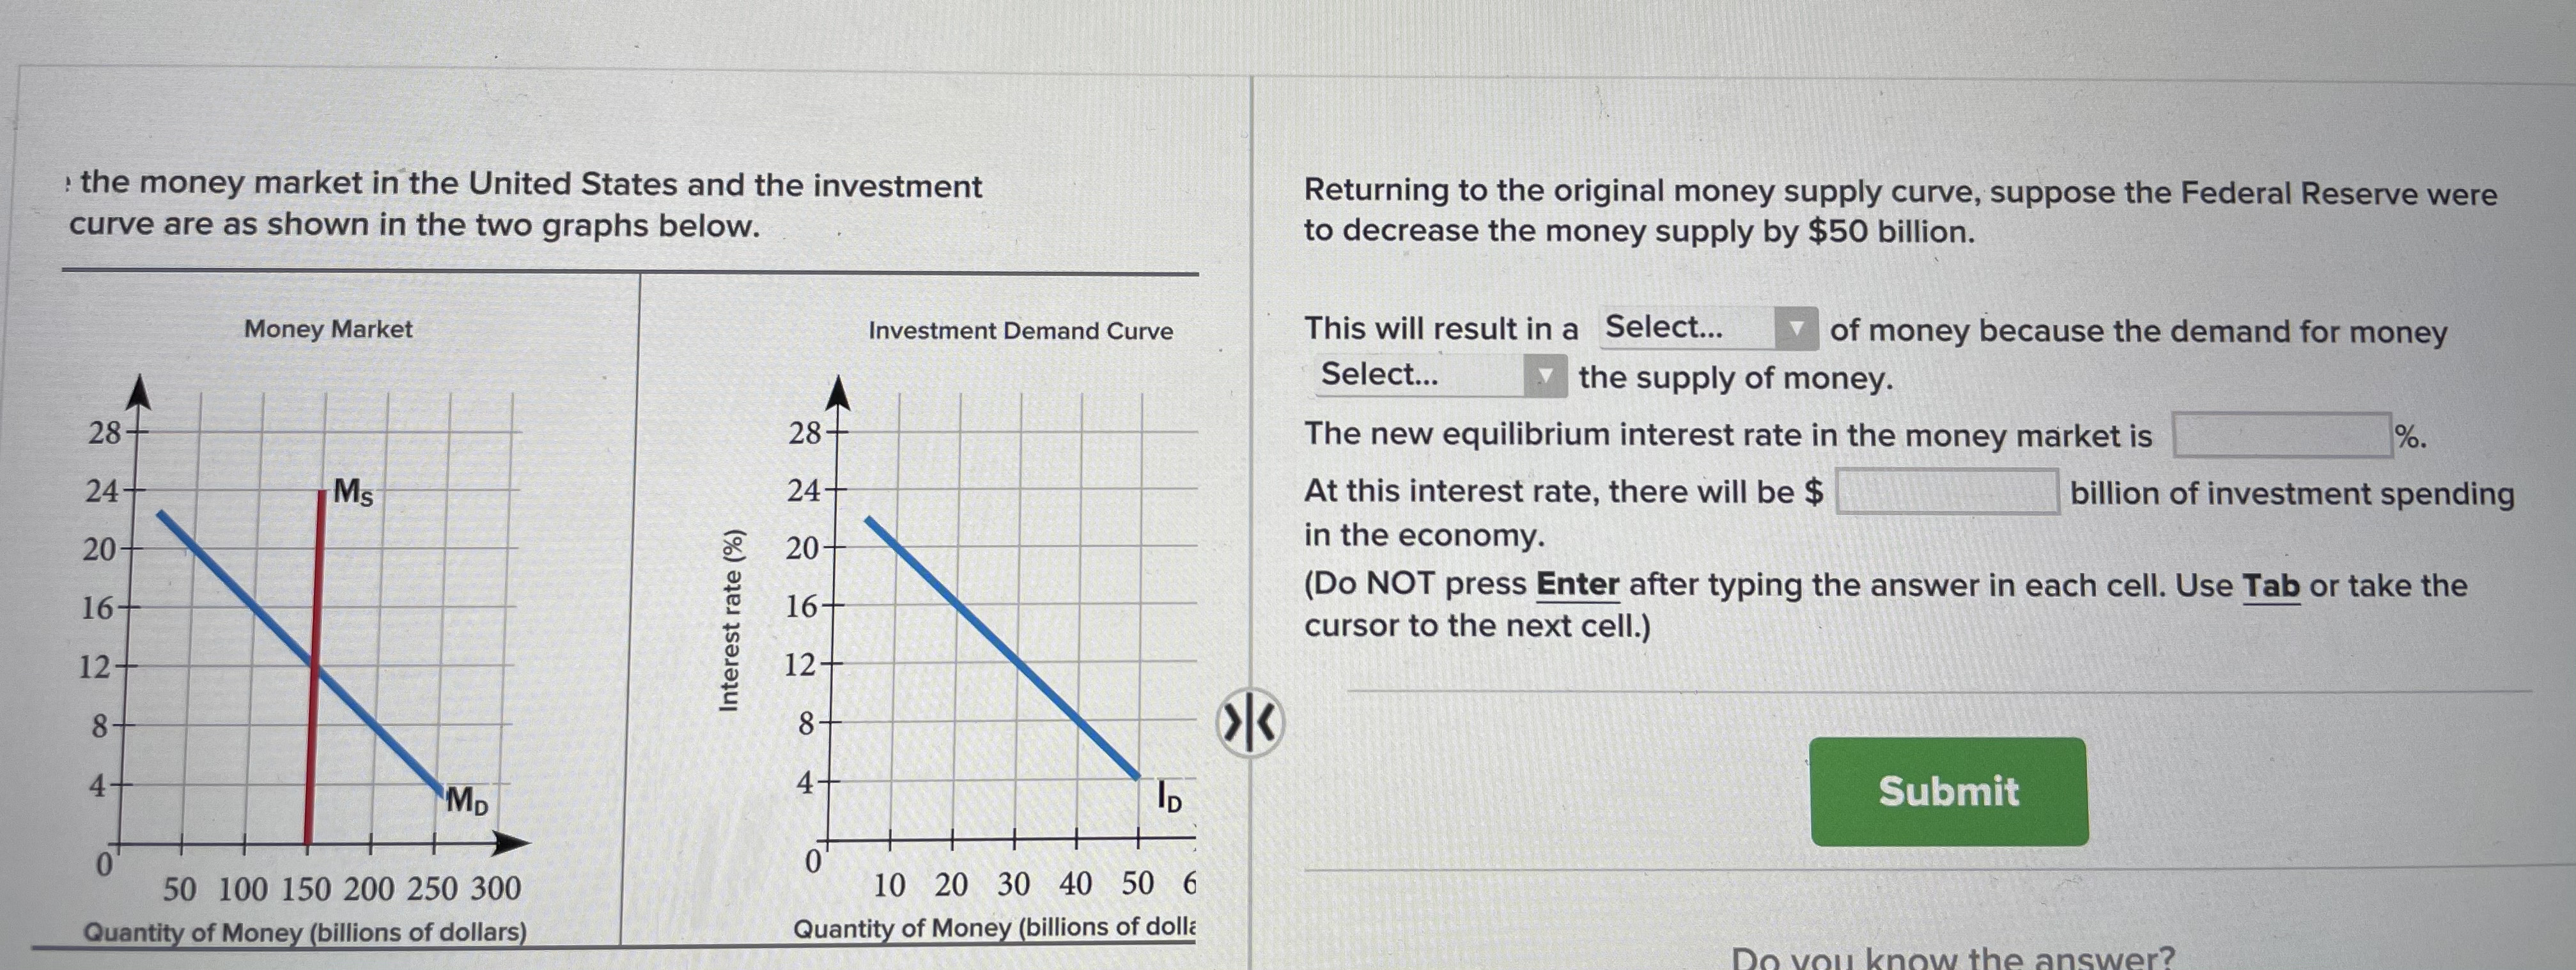
the money market in the United States and the investment curve are as shown in the two graphs below. Money Market Investment Demand Curve Returning to the original money supply curve, suppose the Federal Reserve were to decrease the money supply by $50 billion. This will result ina Select... of money because the demand for money Select... the supply of money. 28 24 20 16 12 8 4 50 100 150 200 250 300 Quant of Mone billions of dollars 28 24 20 16 12 8 4 0 10 20 30 40 50 Quanti of Mone billions of dolli The new equilibrium interest rate in the money market is At this interest rate, there will be $ in the economy. billion of investment spending (Do NOT press Enter after typing the answer in each cell. Use Tab or take the cursor to the next cell.) Submit
Step by Step Solution
There are 3 Steps involved in it

Get step-by-step solutions from verified subject matter experts