

Question: Problem 1: Find the best model you can for these data using your everyday understanding of the variables as a guide. To achieve this
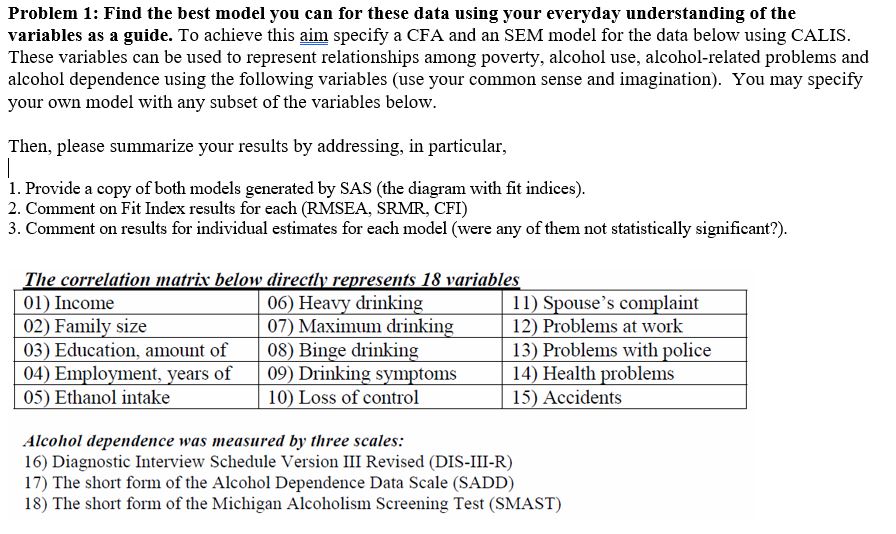

Problem 1: Find the best model you can for these data using your everyday understanding of the variables as a guide. To achieve this aim specify a CFA and an SEM model for the data below using CALIS. These variables can be used to represent relationships among poverty, alcohol use, alcohol-related problems and alcohol dependence using the following variables (use your common sense and imagination). You may specify your own model with any subset of the variables below. Then, please summarize your results by addressing, in particular, 1. Provide a copy of both models generated by SAS (the diagram with fit indices). 2. Comment on Fit Index results for each (RNISEA, SRNIR, CFI) 3. Comment on results for individual estimates for each model (were any of them not statistically significant?). The correlation matrix below directl re resents 18 variables 01 Income 02) Famil size 03) Education, amount of 04) E 10 ent, ears of 05) Ethanol intake 06 Hea drinkin 07) Maximum drinkin 08) Bin chinkin 09) Dlinkin s toms 10 Loss of control II S ouse'scom laint 12) Problems at work 13) Problems with Olice 14) Health roblems 15 Accidents Alcohol dependence was measured by three scales: 16) Diagnostic Interview Schedule Version III Revised (DIS-III-R) 17) The short fonn Of the Alcohol Dependence Data Scale (SADD) 18) The short form Of the Michigan Alcoholism Screening Test (SMAST)
Step by Step Solution
There are 3 Steps involved in it

Get step-by-step solutions from verified subject matter experts