

Question: Crosstabulation EthnicityGroup 35:2-Hispanic or Lati :5-Not Hispanic or Single Table Analysis Odds- and Risk-based parameters 0- No - Yes 38 40.00% 65.52% 20 37.04%
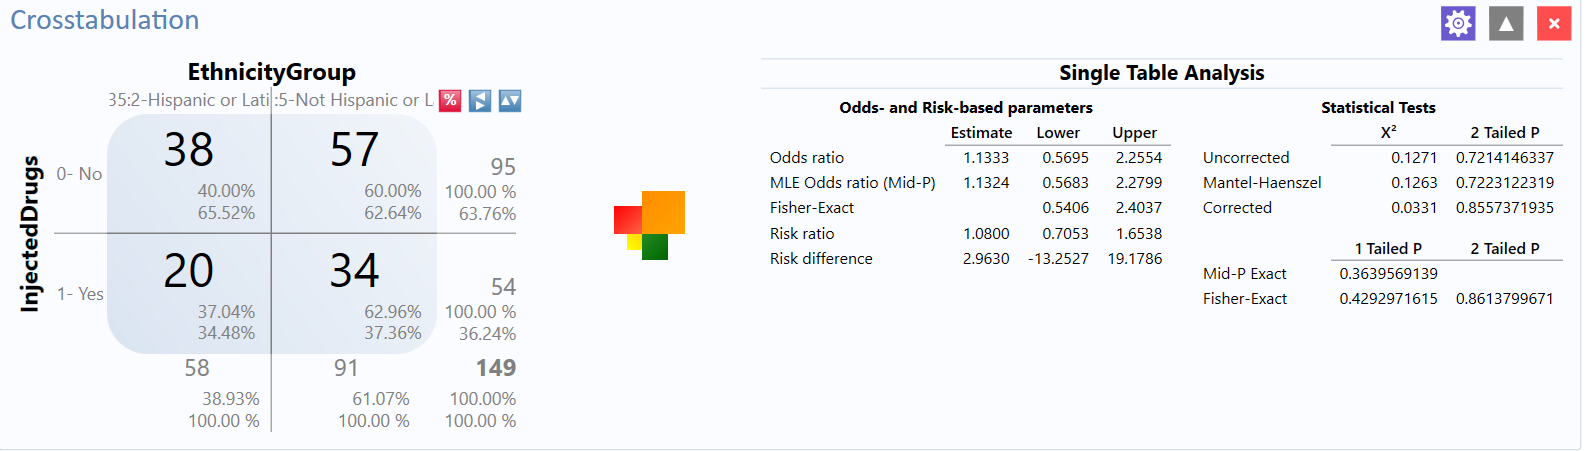

Crosstabulation EthnicityGroup 35:2-Hispanic or Lati :5-Not Hispanic or Single Table Analysis Odds- and Risk-based parameters 0- No - Yes 38 40.00% 65.52% 20 37.04% 34.48% 58 38.93% 100.00 96 57 60.00% 62.64% 34 62.96% 37.36% 91 61.07% 100.00 % 95 100.00 % 63.76% 54 100.00 % 36.24% 149 100.00% 100.00 % Odds ratio MLE Odds ratio (Mid-P) Fisher-Exact Risk ratio Risk difference Estimate 1.1333 1.1324 1.0800 2.9630 Lower 0.5695 0.5683 0.5406 0.7053 -13.2527 Upper 2.2554 2.2799 2.4037 1.6538 19.1786 Uncorrected Mantel-Haenszel Corrected Mid-p Exact Fisher-Exact Statistical Tests 0.1271 0.1263 0.0331 1 Tailed P 0.3639569139 0.4292971615 2 Tailed P 0.7214146337 0.7223122319 0.8557371935 2 Tailed P 0.8613799671
Step by Step Solution
There are 3 Steps involved in it

Get step-by-step solutions from verified subject matter experts