

Question: Ouestion 1 Scatter Plot I (Linear Specification) Y-Axis: Earnings; X-Axis: Education Vi Fm [kfault Zn ANNte 600,000 500,000 400,000 300,000 200,000 100,000 01 0
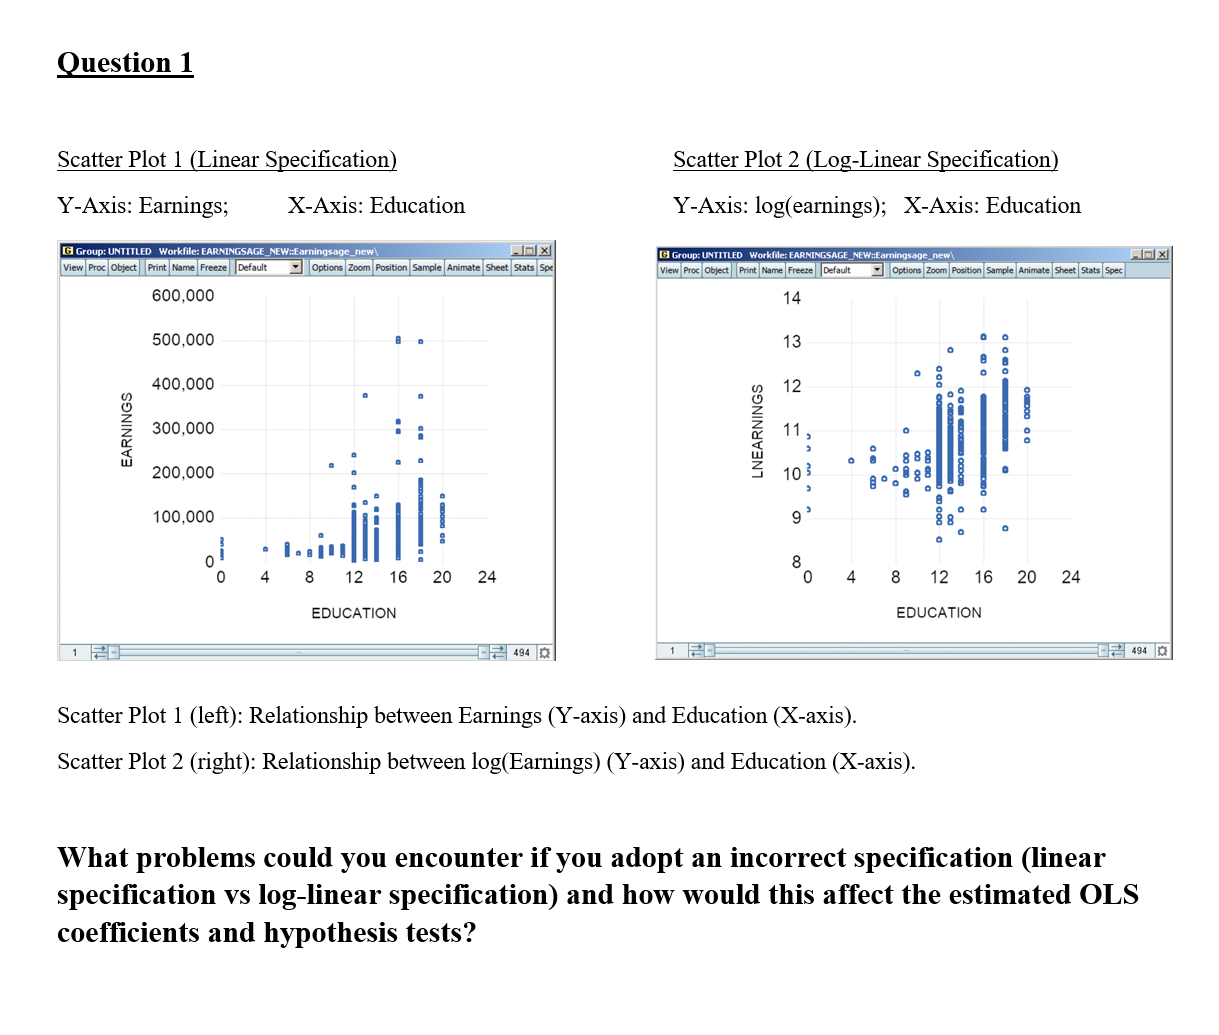

Ouestion 1 Scatter Plot I (Linear Specification) Y-Axis: Earnings; X-Axis: Education Vi Fm [kfault Zn ANNte 600,000 500,000 400,000 300,000 200,000 100,000 01 0 Scatter Plot 2 (Log-Linear Specification) Y-Axis: log(earnings); X-Axis: Education 14 13 12 11, 4 8 12 16 EDUCATION 20 24 8 o 4 8 8 12 16 EDUCATION 20 24 494 Scatter Plot I (left): Relationship between Earnings (Y-axis) and Education (X-axis). Scatter Plot 2 (right): Relationship between log(Earnings) (Y-axis) and Education (X-axis). What problems could you encounter if you adopt an incorrect specification (linear specification vs log-linear specification) and how would this affect the estimated OLS coefficients and hypothesis tests?
Step by Step Solution
There are 3 Steps involved in it

Get step-by-step solutions from verified subject matter experts