

Question: The table below shows money demand and supply schedules for a hypothetical economy Nominal Interest Rate 4 2 Money Demanded (Omo) $ billions 7
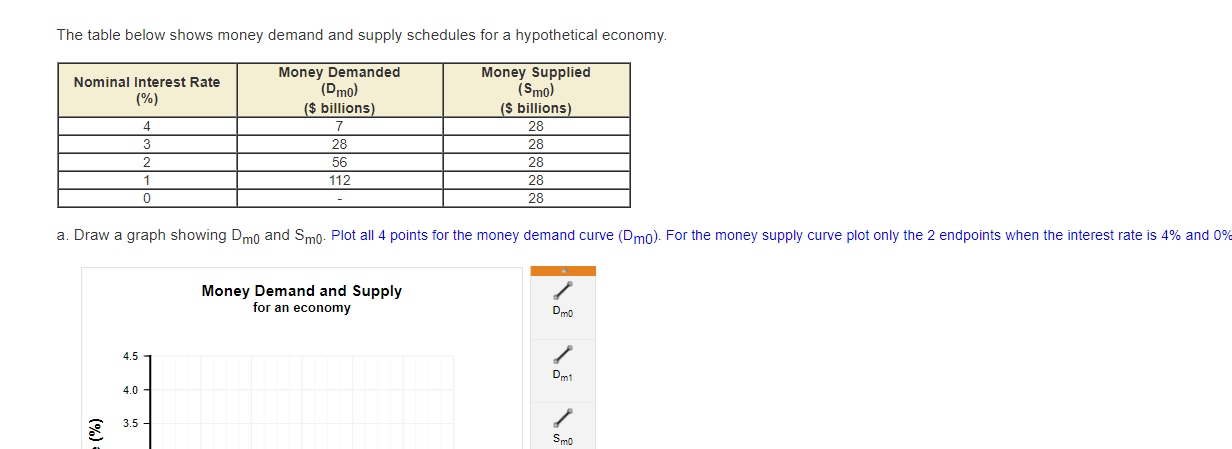
The table below shows money demand and supply schedules for a hypothetical economy Nominal Interest Rate 4 2 Money Demanded (Omo) $ billions 7 28 56 112 Money Supplied (Smo) S billions 28 28 28 28 28 a. Draw a graph showing Dm0 and Plot all 4 points tor the money demand curve (Omo). For the money supply curve plot only the 2 endpoints when the interest rate is 4% and 08', Money Demand and Supply for an economy omo
Step by Step Solution
There are 3 Steps involved in it
1 Expert Approved Answer
Step: 1 Unlock

Question Has Been Solved by an Expert!
Get step-by-step solutions from verified subject matter experts
Step: 2 Unlock
Step: 3 Unlock