

Question: The graph below shows the plot of the log prices for SPOT denoted by denoted by LFUTURES. LSPOT and FUTURES 7.4 7.3 7.2 7.1
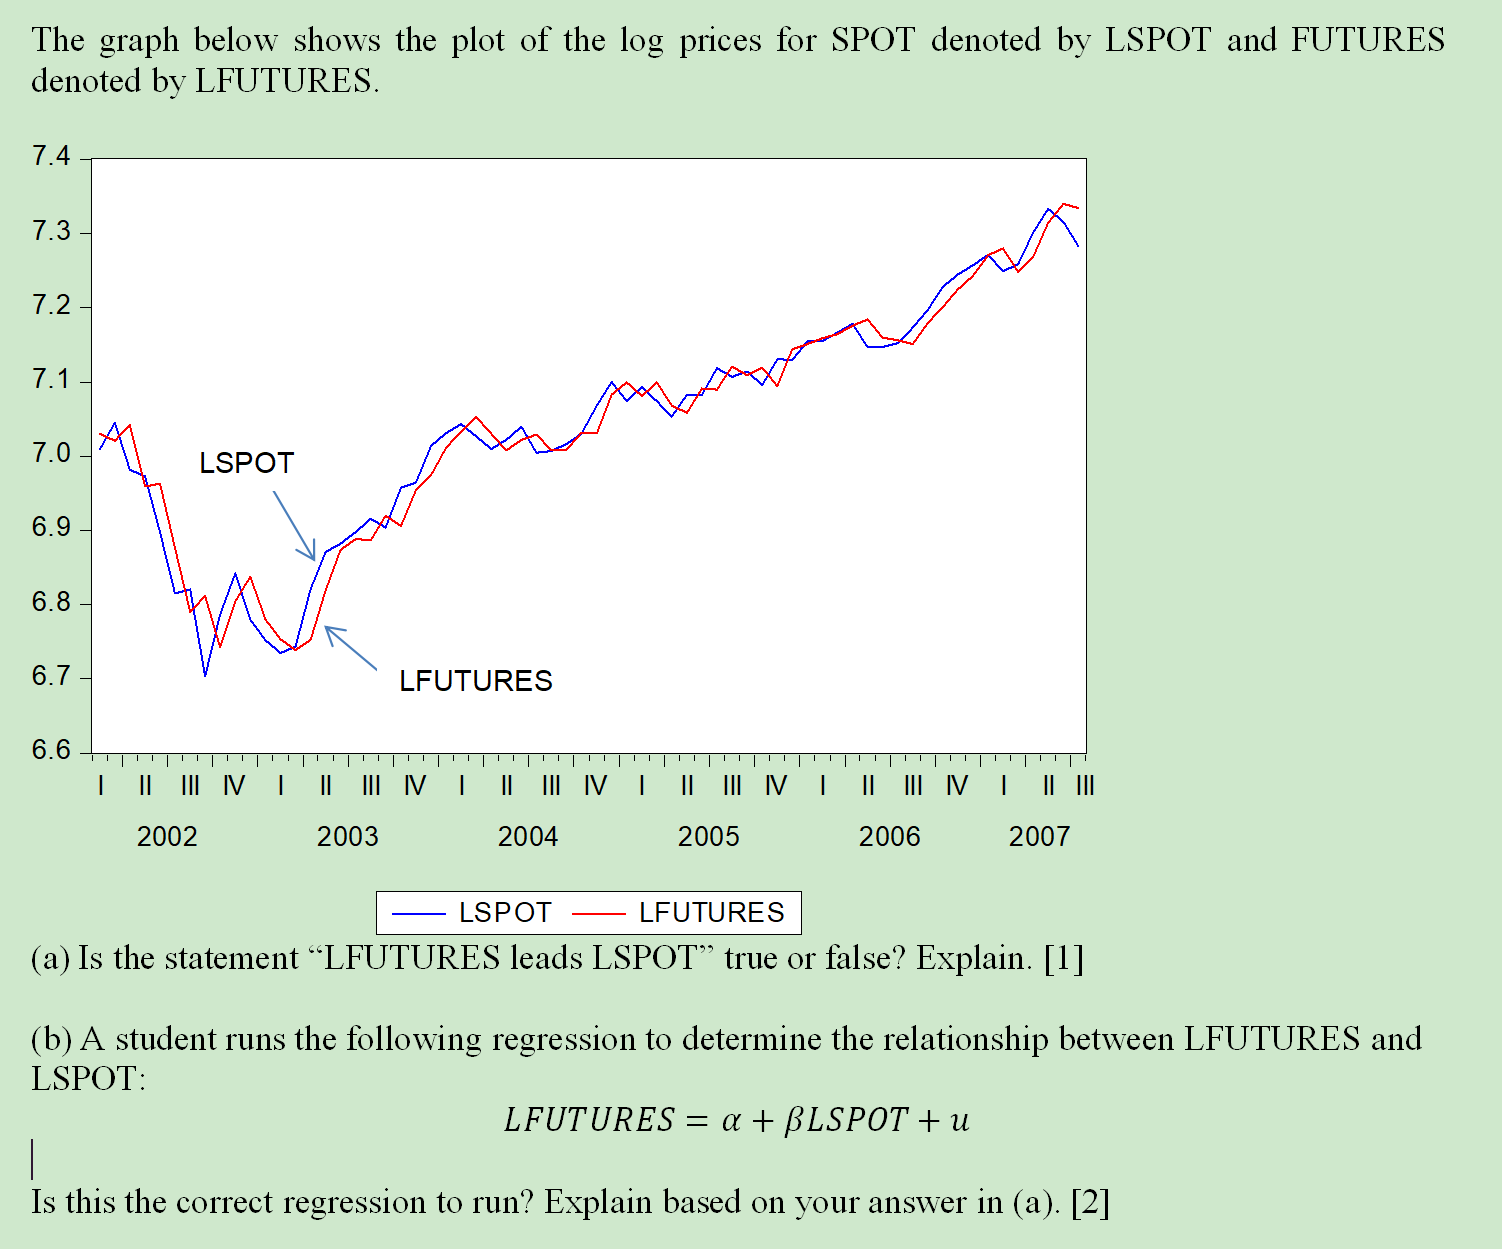
The graph below shows the plot of the log prices for SPOT denoted by denoted by LFUTURES. LSPOT and FUTURES 7.4 7.3 7.2 7.1 7.0 6.9 6.8 6.7 6.6 LSPOT 2002 Ill 2003 LFUTURES Ill 2004 LSPOT Ill 2005 LFUTURES Ill IV 2006 II Ill 2007 (a) Is the statement ' LFUTURES leads LSPOT true or false? Explain. [1] (b) A student runs the following regression to determine the relationship between LFUTURES and LSPOT LFUTURES = a + LSPOT + u Is this the correct regression to run? Explain based on your answer in (a). [2]
Step by Step Solution
There are 3 Steps involved in it
1 Expert Approved Answer
Step: 1 Unlock

Question Has Been Solved by an Expert!
Get step-by-step solutions from verified subject matter experts
Step: 2 Unlock
Step: 3 Unlock