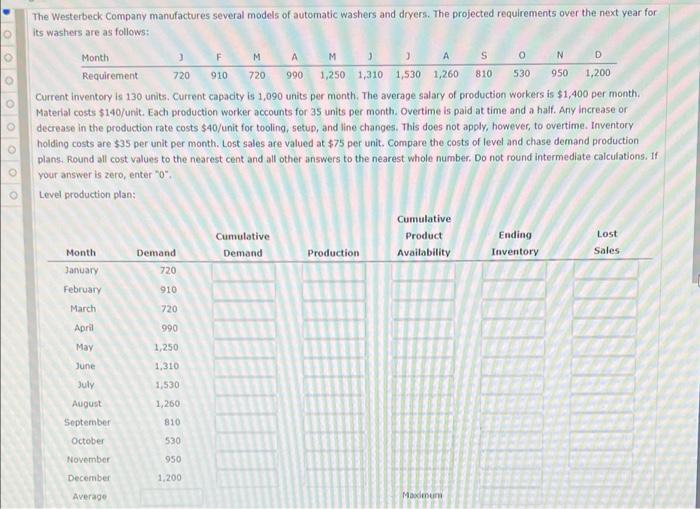
Question: F M M S 0 D 720 910 720 990 The Westerbeck Company manufactures several models of automatic washers and dryers. The projected requirements over

F M M S 0 D 720 910 720 990 The Westerbeck
F M M S 0 D 720 910 720 990 The Westerbeck Company manufactures several models of automatic washers and dryers. The projected requirements over the next year for its washers are as follows: Month 1 N Requirement 1,250 1,310 1,530 1,260 810 530 950 1,200 Current inventory is 130 units. Current capacity is 1,090 units per month. The average salary of production workers is $1,400 per month. Material costs $140/unit. Each production worker accounts for 35 units per month Overtime is paid at time and a half. Any increase or decrease in the production rate costs $40/unit for toolina, setup, and lino changes. This does not apply, however, to overtime. Inventory holding costs are $35 per unit per month. Lost sales are valued at $75 per unit. Compare the costs of level and chase demand production plans, Round all cost values to the nearest cent and all other answers to the nearest whole number. Do not round intermediate calculations. In your answer is zero, enter"0" Level production plan: Cumulative Cumulative Product Ending Lost Month Demand Availability Inventory Sales January February 910 Demand Production 720 March 720 April 990 May 1,250 June 1,310 July 1.530 1,260 August September 810 530 October November 950 December 1.200 Average Maxmuni Lost Sales Production Cost Inventory Cost Overtime Cost Undertime Cost Rate Change Cost Month Cost January $ $ $ $ $ $ February $ $ $ $ $ $ March $ $ $ $ $ $ April $ $ $ $ $ $ May $ $ $ $ $ $ June $ $ $ $ $ $ July $ $ $ $ $ $ $ $ $ $ $ $ August September $ $ $ $ $ October $ $ $ $ $ November $ $ $ $ $ December $ $ $ Totals $ $ $ Total costs Chase demand production plan: Cumulative Demand Cumulative Product Availability Lost Sales Ending Inventory Month January Production Demand 720 910 February March G 720 April 990 May 1.250 June July August September 1310 1.530 1,260 310 October November 1530 950 December 1,200 Average Madium Cost Cost Cost COSE Month January $ $ $ $ 3 $ $ February $ $ $ $ $ March $ $ $ $ April $ $ $ $ May $ $ $ $ June $ $ $ $ July $ $ $ $ August 5 $ $ $ September $ $ $ October $ $ 5 $ November December $ $ $ $ $ Totals $ A Total cost: 3 The total cost for level strategy is set than the total cost for chase strategy Check My Work ( remaining)

Step by Step Solution

There are 3 Steps involved in it

1 Expert Approved Answer
Step: 1 Unlock blur-text-image
Question Has Been Solved by an Expert!

Get step-by-step solutions from verified subject matter experts

Step: 2 Unlock
Step: 3 Unlock

Students Have Also Explored These Related General Management Questions!