

Question: this is all one question! Hint(s) Check My Work EB Spreadsheet The Westerbeck Company manufactures several models of automatic washers and dryers. The projected requirements
 this is all one question!
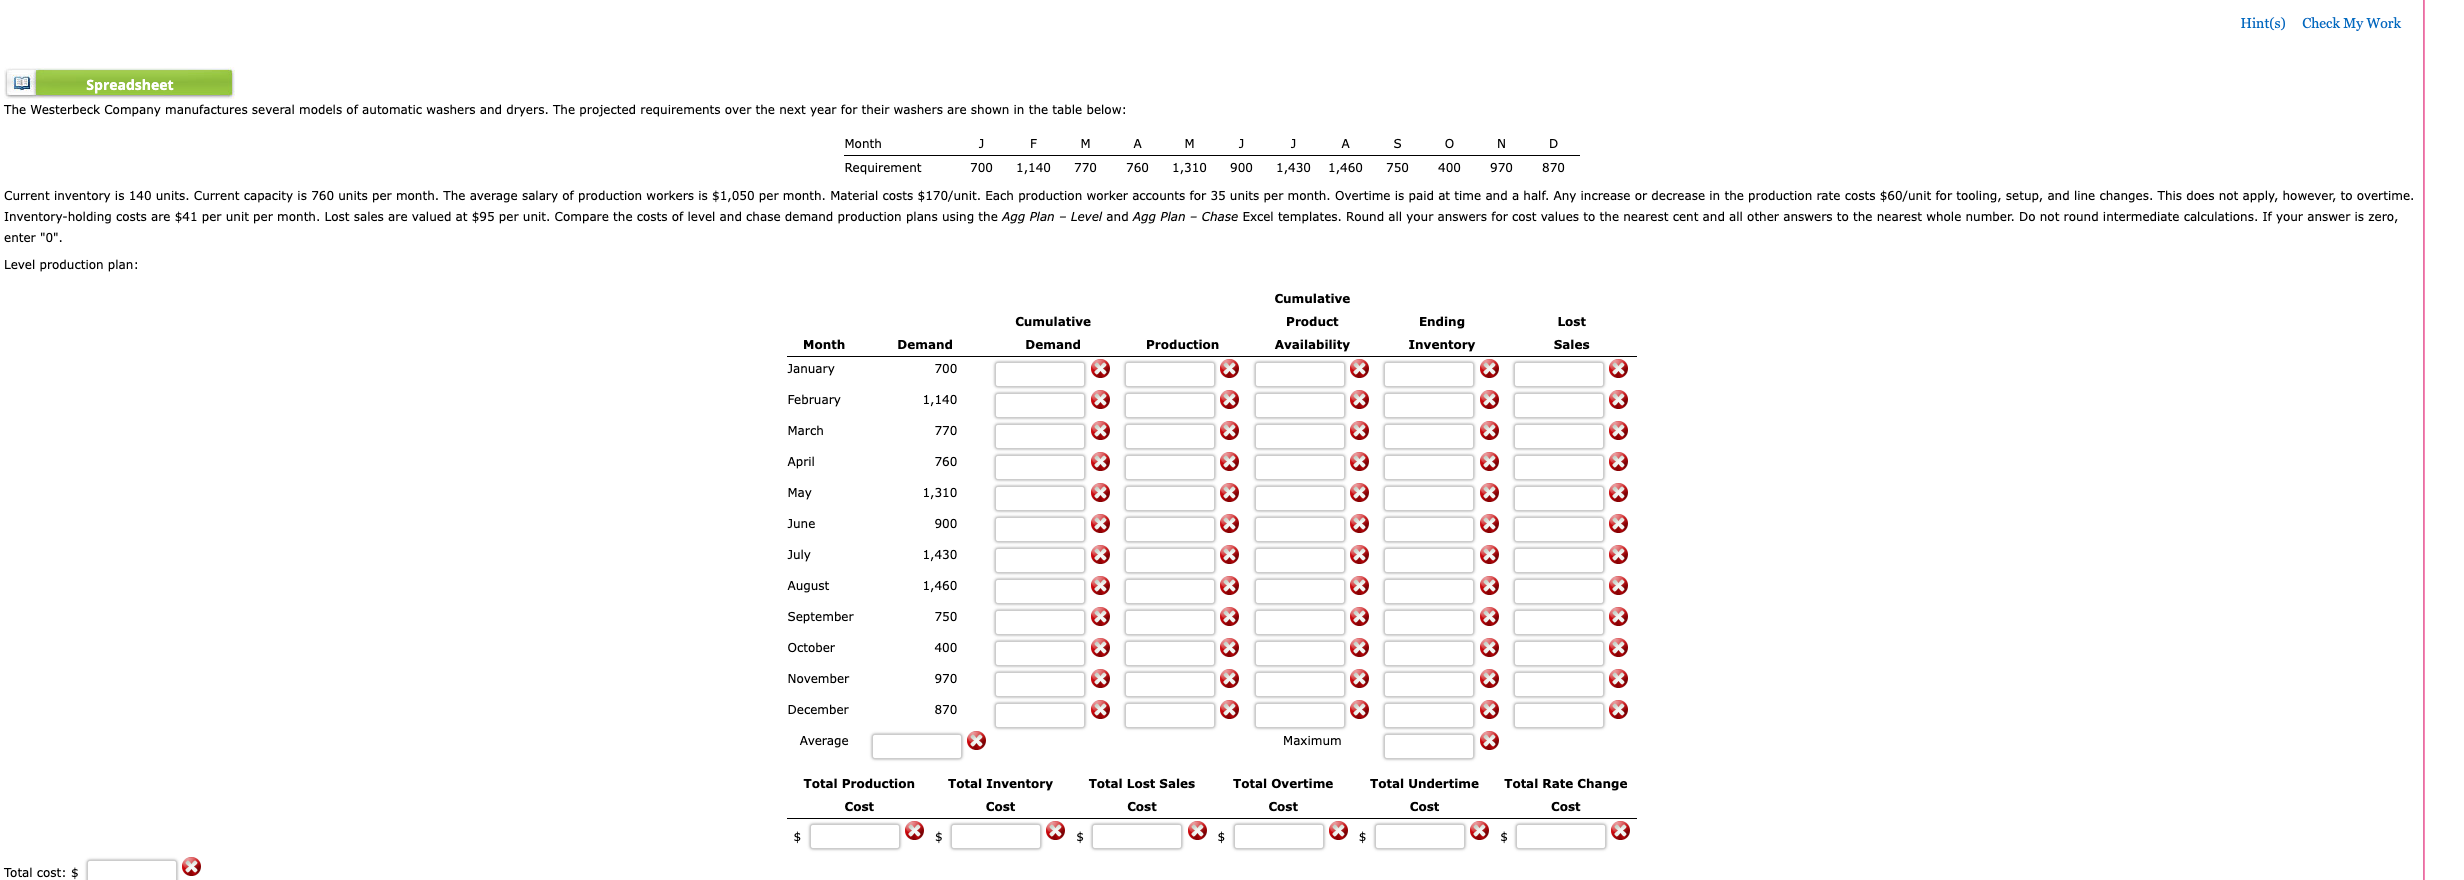
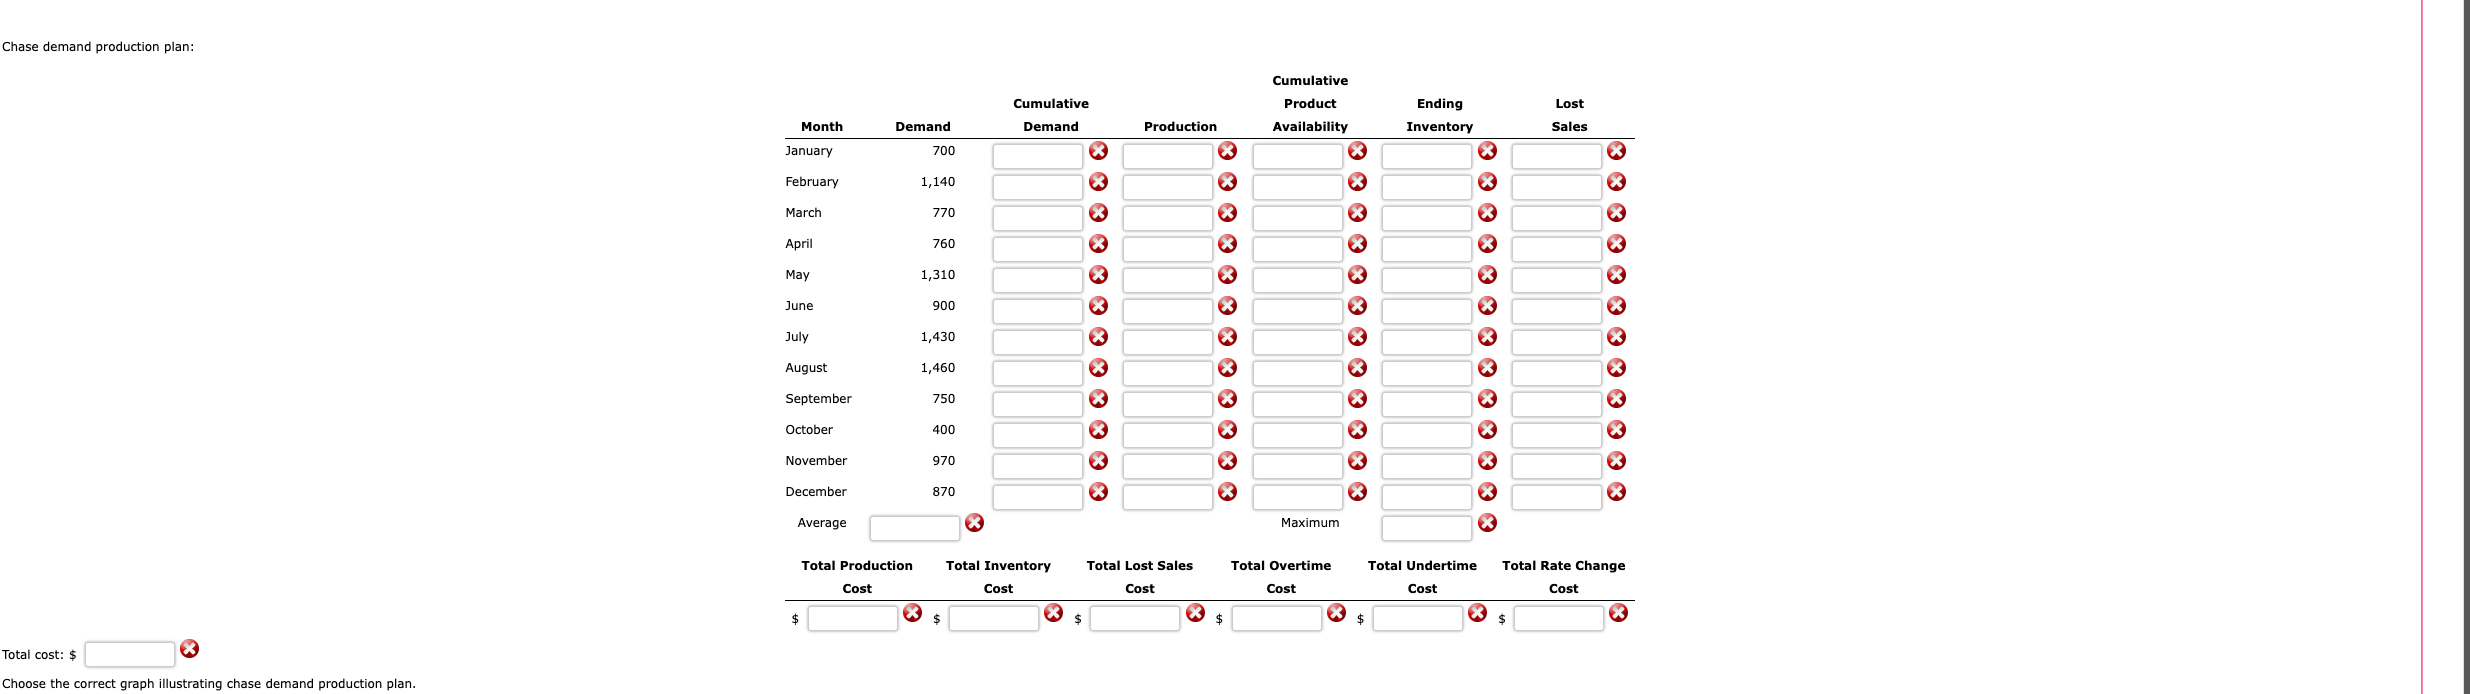
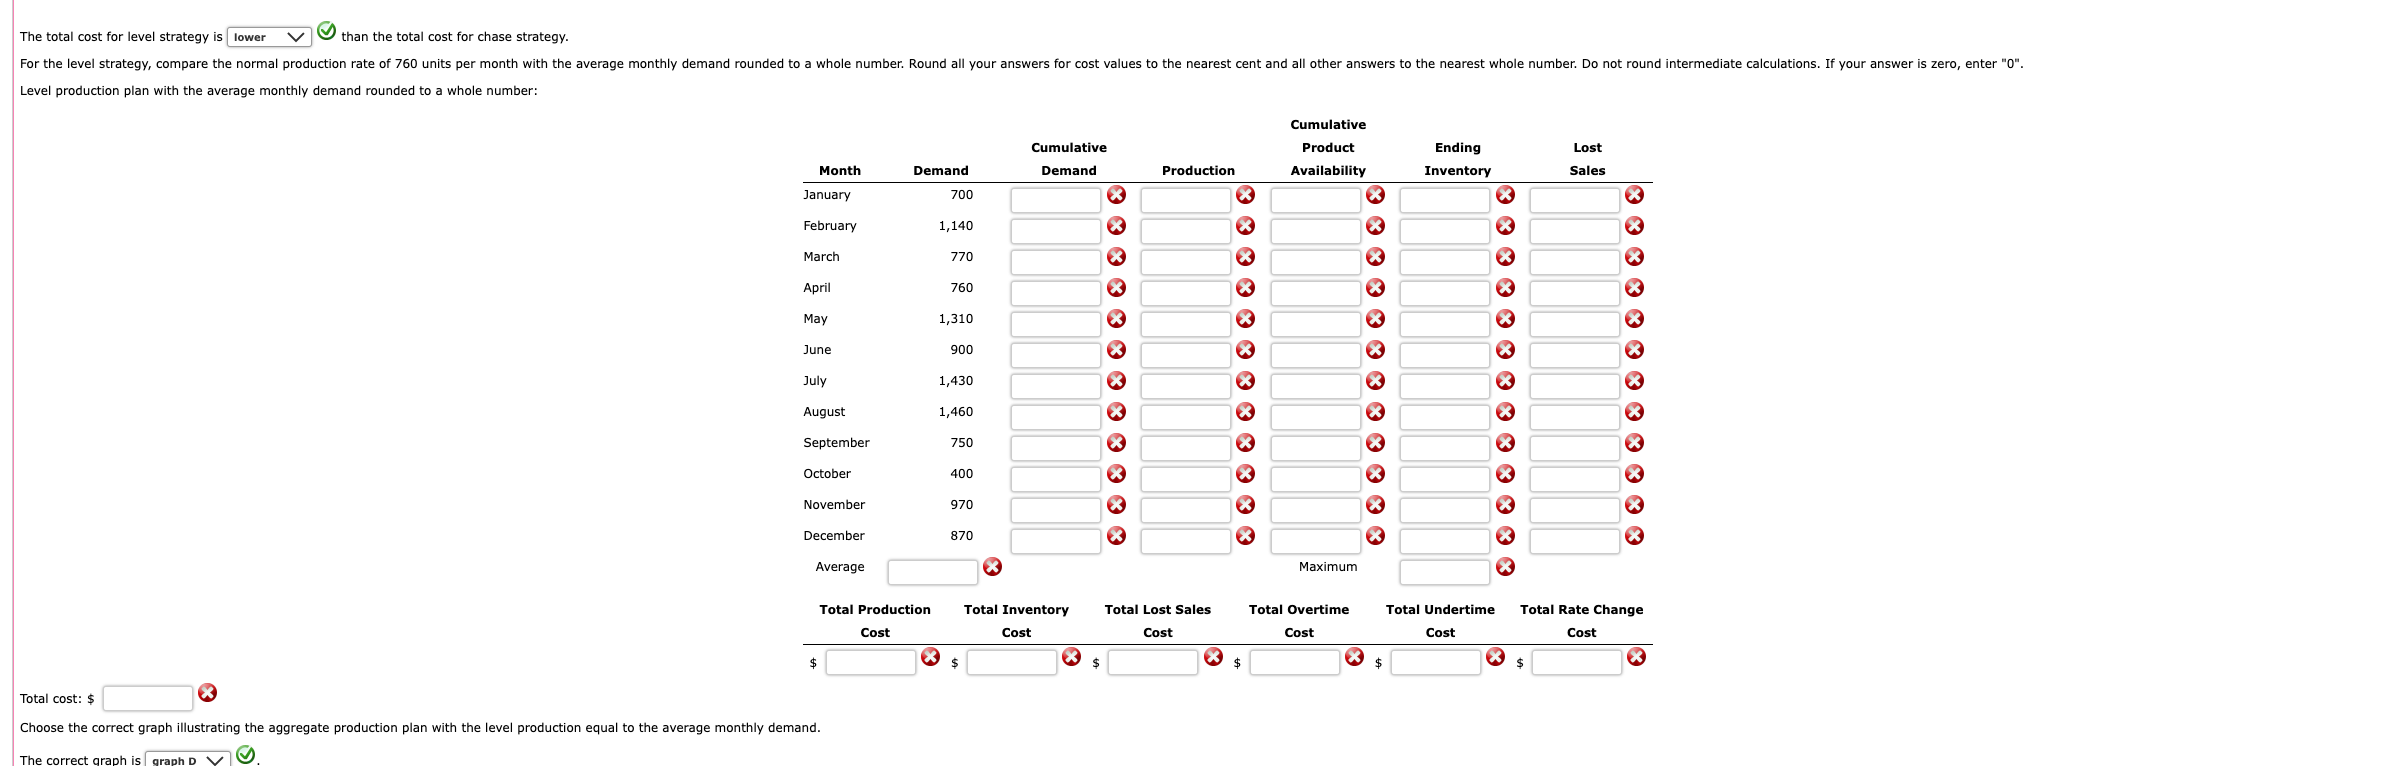
Hint(s) Check My Work EB Spreadsheet The Westerbeck Company manufactures several models of automatic washers and dryers. The projected requirements over the next year for their washers are shown in the table below: M . S 0 D 870 Month J F M A J J N Requirement 700 1,140 770 760 1,310 900 1,430 1,460 750 400 970 Current inventory is 140 units. Current capacity is 760 units per month. The average salary of production workers is $1,050 per month. Material costs $170/unit. Each production worker accounts for 35 units per month. Overtime is paid at time and a half. Any increase or decrease in the production rate costs $60/unit for tooling, setup, and line changes. This does not apply, however, to overtime. Inventory-holding costs are $41 per unit per month. Lost sales are valued at $95 per unit. Compare the costs of level and chase demand production plans using the Agg Plan - Level and Agg Plan - Chase Excel templates. Round all your answers for cost values to the nearest cent and all other answers to the nearest whole number. Do not round intermediate calculations. If your answer is zero, enter "O". Level production plan: Cumulative Product Availability Cumulative Demand Lost Ending Inventory Production Sales Month January Demand 700 X February 1,140 * * * * March 770 April 760 X May 1,310 June 900 July 1,430 August * 1,460 X September 750 x 3 October 400 x November 970 December 870 X Average 8 Maximum Total Inventory Total Undertime Total Production Cost Total Lost Sales Cost Total Overtime Cost Total Rate Change Cost Cost Cost X $ $ $ Total cost: $ Chase demand production plan: Cumulative Product Lost Cumulative Demand Ending Inventory Month Demand Production Availability Sales January 700 February 1,140 March 770 X X April 760 X X X May 1,310 X June 900 X X X X X X X X X X X X X July 1,430 August 1,460 September 750 X October 400 November 970 December 870 Average Maximum X Total Lost Sales Total Overtime Total Production Cost Total Inventory Cost Total Undertime Cost Total Rate Change Cost Cost Cost $ $ $ X $ Total cost: $ Choose the correct graph illustrating chase demand production plan. The total cost for level strategy is lower than the total cost for chase strategy. For the level strategy, compare the normal production rate of 760 units per month with the average monthly demand rounded to a whole number. Round all your answers for cost values to the nearest cent and all other answers to the nearest whole number. Do not round intermediate calculations. If your answer is zero, enter "0". Level production plan with the average monthly demand rounded to a whole number: Cumulative Product Lost Cumulative Demand Ending Inventory Month Production Availability Sales Demand 700 January x February 1,140 March 770 April 760 X May 1,310 X June 900 X July 1,430 X August 1,460 X X X X X X X X X September 750 October 400 November 970 X December 870 X Average Maximum Total Production Total Lost Sales Total Overtime Total Undertime Total Inventory Cost Total Rate Change Cost Cost Cost Cost Cost $ X X $ $ $ $ $ Total cost: $ Choose the correct graph illustrating the aggregate production plan with the level production equal to the average monthly demand. The correct graph is graph DV Hint(s) Check My Work EB Spreadsheet The Westerbeck Company manufactures several models of automatic washers and dryers. The projected requirements over the next year for their washers are shown in the table below: M . S 0 D 870 Month J F M A J J N Requirement 700 1,140 770 760 1,310 900 1,430 1,460 750 400 970 Current inventory is 140 units. Current capacity is 760 units per month. The average salary of production workers is $1,050 per month. Material costs $170/unit. Each production worker accounts for 35 units per month. Overtime is paid at time and a half. Any increase or decrease in the production rate costs $60/unit for tooling, setup, and line changes. This does not apply, however, to overtime. Inventory-holding costs are $41 per unit per month. Lost sales are valued at $95 per unit. Compare the costs of level and chase demand production plans using the Agg Plan - Level and Agg Plan - Chase Excel templates. Round all your answers for cost values to the nearest cent and all other answers to the nearest whole number. Do not round intermediate calculations. If your answer is zero, enter "O". Level production plan: Cumulative Product Availability Cumulative Demand Lost Ending Inventory Production Sales Month January Demand 700 X February 1,140 * * * * March 770 April 760 X May 1,310 June 900 July 1,430 August * 1,460 X September 750 x 3 October 400 x November 970 December 870 X Average 8 Maximum Total Inventory Total Undertime Total Production Cost Total Lost Sales Cost Total Overtime Cost Total Rate Change Cost Cost Cost X $ $ $ Total cost: $ Chase demand production plan: Cumulative Product Lost Cumulative Demand Ending Inventory Month Demand Production Availability Sales January 700 February 1,140 March 770 X X April 760 X X X May 1,310 X June 900 X X X X X X X X X X X X X July 1,430 August 1,460 September 750 X October 400 November 970 December 870 Average Maximum X Total Lost Sales Total Overtime Total Production Cost Total Inventory Cost Total Undertime Cost Total Rate Change Cost Cost Cost $ $ $ X $ Total cost: $ Choose the correct graph illustrating chase demand production plan. The total cost for level strategy is lower than the total cost for chase strategy. For the level strategy, compare the normal production rate of 760 units per month with the average monthly demand rounded to a whole number. Round all your answers for cost values to the nearest cent and all other answers to the nearest whole number. Do not round intermediate calculations. If your answer is zero, enter "0". Level production plan with the average monthly demand rounded to a whole number: Cumulative Product Lost Cumulative Demand Ending Inventory Month Production Availability Sales Demand 700 January x February 1,140 March 770 April 760 X May 1,310 X June 900 X July 1,430 X August 1,460 X X X X X X X X X September 750 October 400 November 970 X December 870 X Average Maximum Total Production Total Lost Sales Total Overtime Total Undertime Total Inventory Cost Total Rate Change Cost Cost Cost Cost Cost $ X X $ $ $ $ $ Total cost: $ Choose the correct graph illustrating the aggregate production plan with the level production equal to the average monthly demand. The correct graph is graph DV
Step by Step Solution
There are 3 Steps involved in it
1 Expert Approved Answer
Step: 1 Unlock

Question Has Been Solved by an Expert!
Get step-by-step solutions from verified subject matter experts
Step: 2 Unlock
Step: 3 Unlock