

Question: F. Using Transformations to Model Data #1, #3 Choose of the metrics listed in the table below and complete the following: a) Plot the data
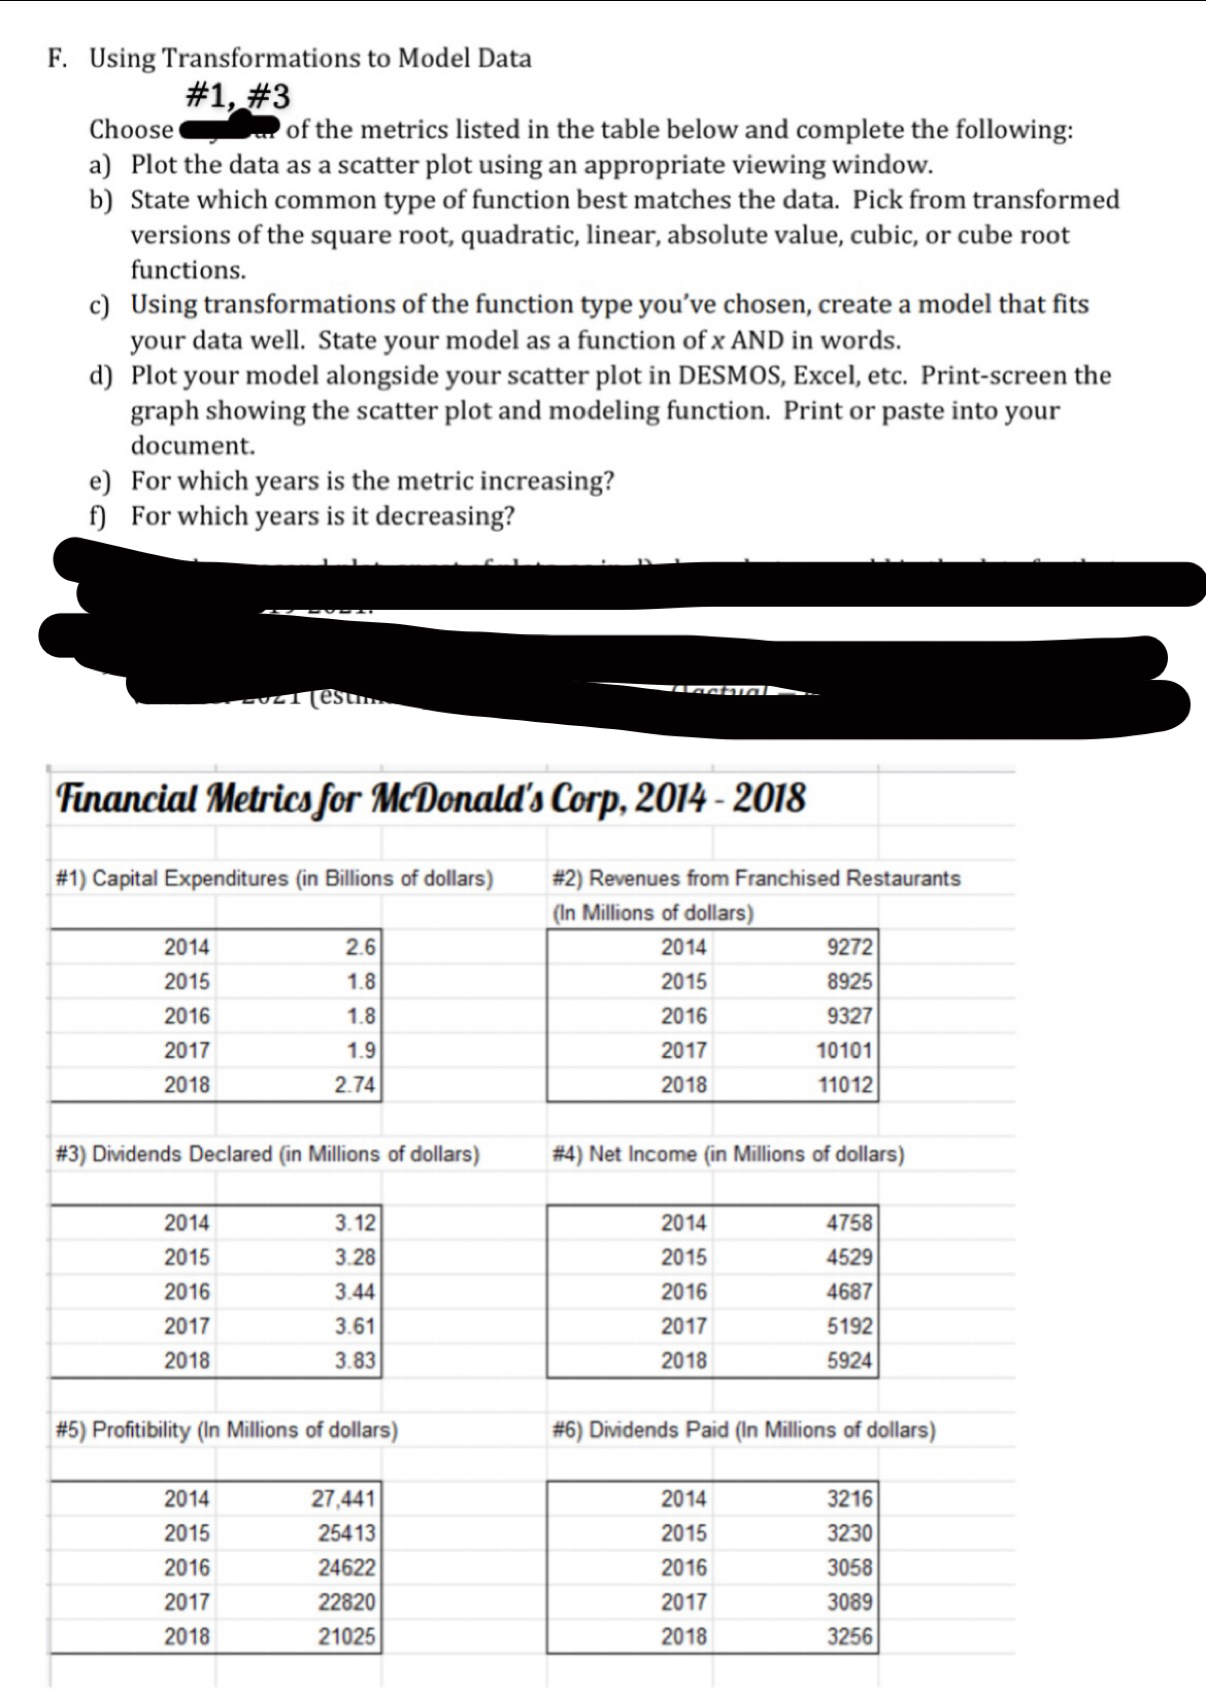
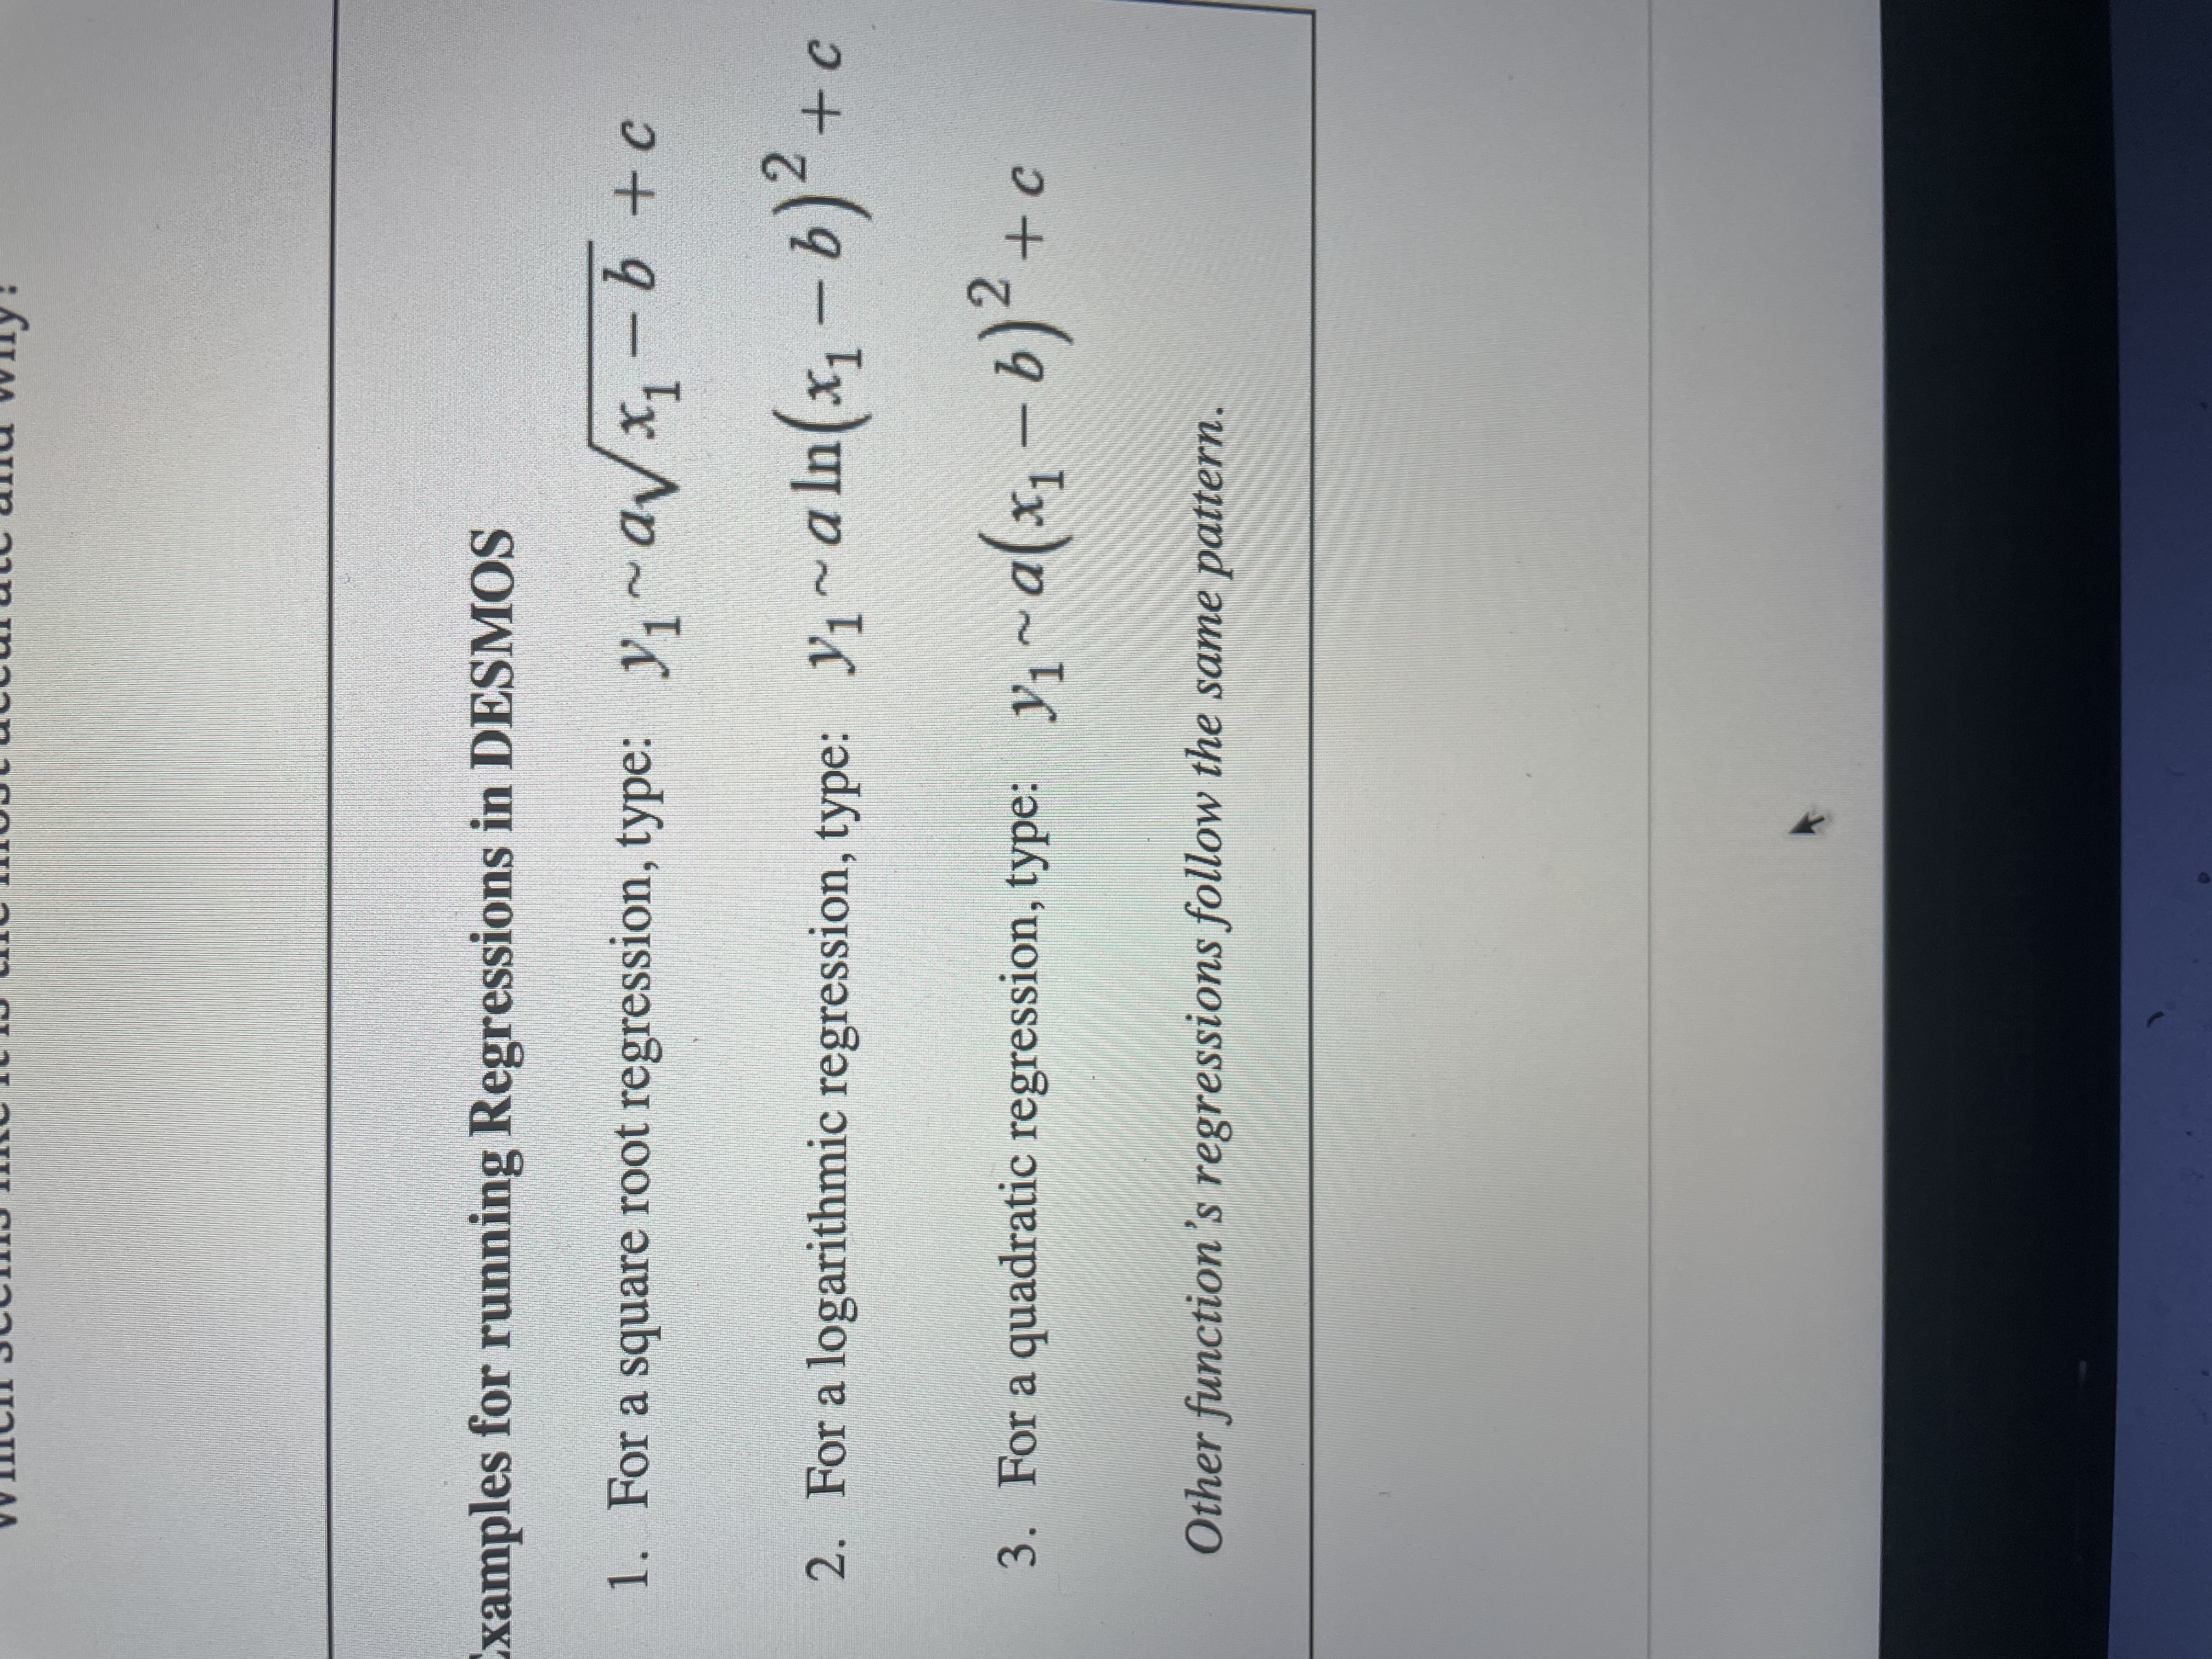
F. Using Transformations to Model Data #1, #3 Choose of the metrics listed in the table below and complete the following: a) Plot the data as a scatter plot using an appropriate viewing window. b) State which common type of function best matches the data. Pick from transformed versions of the square root, quadratic, linear, absolute value, cubic, or cube root functions. c) Using transformations of the function type you've chosen, create a model that fits your data well. State your model as a function of x AND in words. d) Plot your model alongside your scatter plot in DESMOS, Excel, etc. Print-screen the graph showing the scatter plot and modeling function. Print or paste into your document. e) For which years is the metric increasing? f) For which years is it decreasing? Financial Metrics for Mcdonald's Corp, 2014 - 2018 #1) Capital Expenditures (in Billions of dollars) #2) Revenues from Franchised Restaurants (In Millions of dollars) 2014 2.6 2014 9272 2015 1.8 2015 8925 2016 1.8 2016 9327 2017 19 2017 10101 2018 2.74 2018 11012 #3) Dividends Declared (in Millions of dollars) #4) Net Income (in Millions of dollars) 2014 3.12 2014 4758 2015 3.28 2015 4529 2016 3.44 2016 4687 2017 3.61 2017 5192 2018 3.83 2018 5924 #5) Profitibility (In Millions of dollars) #6) Dividends Paid (In Millions of dollars) 2014 27,441 2014 3216 2015 25413 2015 3230 2016 24622 2016 3058 2017 22820 2017 3089 2018 21025 2018 3256xamples for running Regressions in DESMOS 1. For a square root regression, type: y, ~av x, - b + c 2. For a logarithmic regression, type: V1 ~ a In(x] - b)2 + c 3. For a quadratic regression, type: y, ~a(x, - b)2 + c Other function's regressions follow the same pattern
Step by Step Solution
There are 3 Steps involved in it

Get step-by-step solutions from verified subject matter experts