Question: F1 fx Cengage Learning B C D E F G H 1 j K NOTE: This worksheet is not loc Be careful not to change
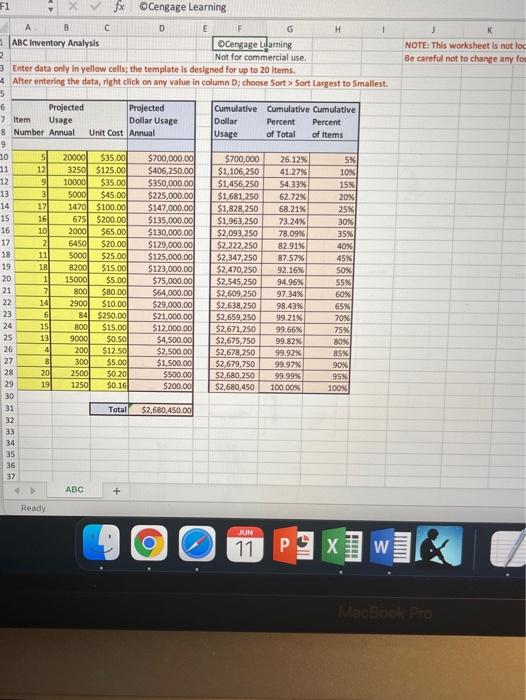
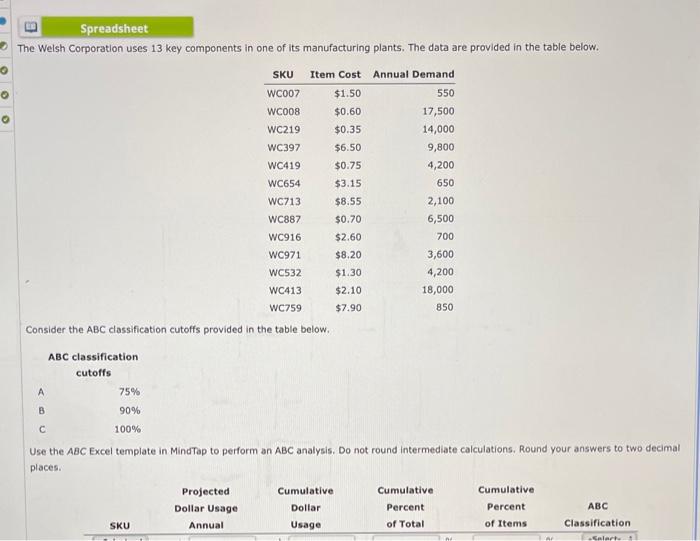
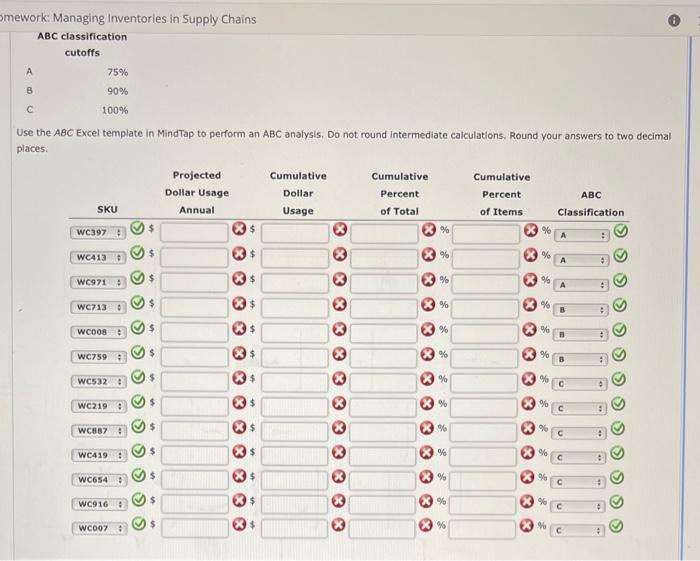
F1 fx Cengage Learning B C D E F G H 1 j K NOTE: This worksheet is not loc Be careful not to change any fos F ABC Inventory Analysis Cengage Llarning 2 Not for commercial use. 3 Enter data only in yellow cells; the template is designed for up to 20 items - After entering the data, right click on any value in column D; choose Sort > Sort Largest to Smallest. 5 6 Projected Projected Cumulative Cumulative Cumulative 7 Item Usage Dollar Usage Dollar Percent Percent 8 Number Annual Unit Cost Annual Usage of Total of Items 9 10 S 20000 $35.00 $700,000.00 $700,000 26.12% 5% 31 12 3250 $125.00 $406,250.00 $1,106,250 41.27% 10% 12 9 10000 $35.00 $350,000.00 $1.456,250 54.33% 15% 13 3 5000 $45.00 $225,000.00 $1,681,250 62.72% 20% 14 17 1470 $100.00 $147,000.00 $1,828,250 68.21% 25% 15 16 675 $200.00 $135,000.00 $1,963.250 73.24% 30% 16 10 $65.00 $130,000.00 $2,093,250 78.09% 35% 17 2 6450 $20.00 $129,000.00 $2,222,250 82.91% 40% 18 11 5000 $25.00 $125,000.00 $2,347,250 87.57% 45% 19 18 8200 $15.00 $223,000.00 $2,470,250 92.16% 50% 20 1 15000 $5.00 $75,000.00 $2,545,250 94.96% 55% 21 7 800 $80.00 $64,000.00 $2,609 250 97 34% 60% 22 14 2900 $10.00 $29,000.00 $2,638,250 98.43% 65 23 6 841 $250.00 $21,000.00 $2,659,250 99.21% 70% 24 15 800 $15.00 $12,000.00 $2,671,250 99.66% 75% 25 13 9000 $0.50 $4,500.00 $2,675,750 99.82% BOX 26 4 200 $12.50 $2,500.00 $2,678,250 99.92% BSX 27 8 3001 $5.00 $1,500.00 $2,679,750 99.97% 9016 28 20 2500 50.20 $500.00 $2,680,250 99.99% 95% 29 19 1250 $0.16 $200.00 $2,680,450 100.00% 100% 30 31 Total $2,680,450.00 22 MIMI nwunm 33 34 35 36 37 ABC + Ready JUN O 11 W MacBook Pro Spreadsheet The Welsh Corporation uses 13 key components in one of its manufacturing plants. The data are provided in the table below. SKU Item Cost Annual Demand WC007 $1.50 550 WC008 $0.60 17,500 WC219 $0.35 14,000 WC397 $6.50 9,800 WC419 $0.75 4,200 WC654 $3.15 650 WC713 $8.55 2,100 WC887 $0.70 6,500 WC916 $2.60 700 WC971 $8.20 3,600 WC532 $1.30 4,200 WC413 $2.10 18,000 WC759 $7.90 850 Consider the ABC classification cutoffs provided in the table below. ABC classification cutoffs A 75% B 90% 100% Use the ABC Excel template in MindTap to perform an ABC analysis. Do not round intermediate calculations. Round your answers to two decimal places Projected Cumulative Cumulative Cumulative Dollar Usage Dollar Percent Percent ABC SKU Annual Usage of Total of Items Classification Calart mework: Managing Inventories in Supply Chains ABC classification cutoffs 75% B 90% c 100% Use the ABC Excel template In MindTap to perform an ABC analysis, Do not round Intermediate calculations. Round your answers to two decimal places Projected Cumulative Cumulative Cumulative Dollar Usage Dollar Percent Percent ABC SKU Annual Usage of Total of Items Classification WC397 % % A . $ WC413 % % A . $ WC971 $ % A . WC713 $ $ % % B WC008 $ $ % % WC759 $ % % . WC532 % X% WC219 % % : WC887 X X% X WC419 % % WC654 $ % $ $ $ % WC916 % 96 + WC007 % +