

Question: F25 A C D 7 Macy's Industry ttvals (average) 2017 2013 2019 201 2017 2019 2019 GLASS) 10) GLA00 Return on Equity ROE (15) =
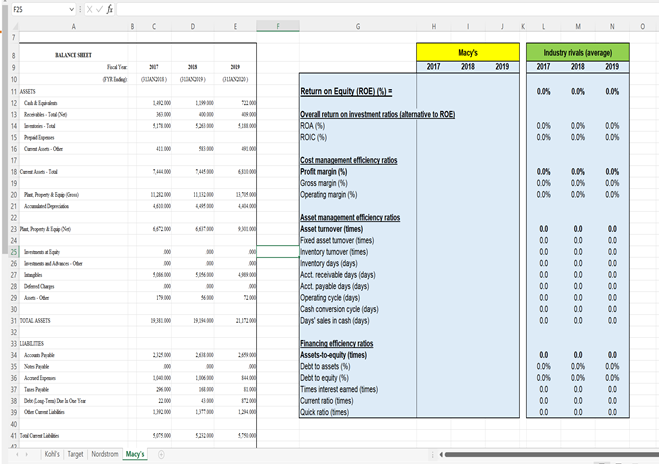
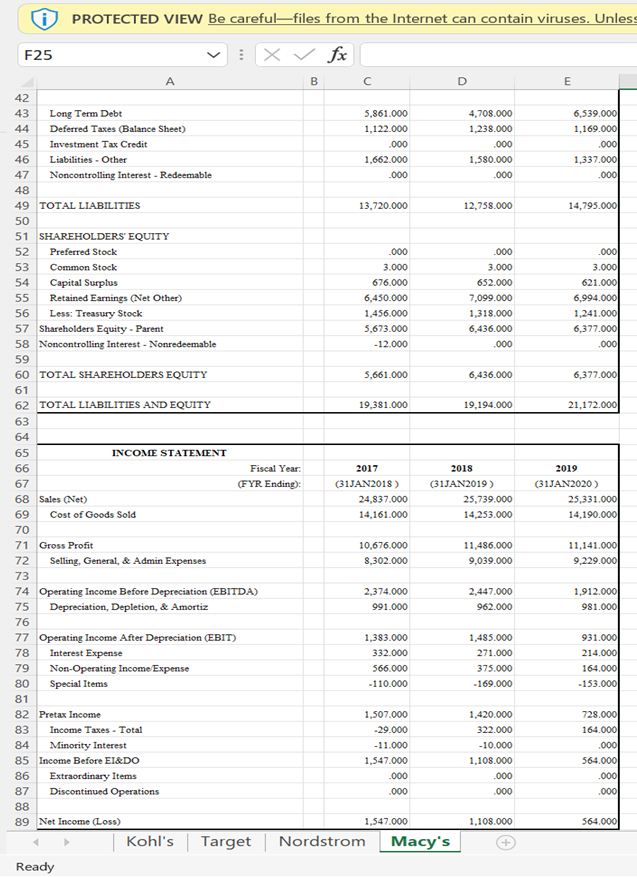
F25 A C D 7 Macy's Industry ttvals (average) 2017 2013 2019 201 2017 2019 2019 GLASS) 10) GLA00 Return on Equity ROE (15) = 0.0% 0.0% 0.0% 120.000 200 19.00 22:00 9.00 100 Overall return on investment ratios (alternative to ROE ROA (%) ROIC 0.0% 00% 0.0% 0.0% 0.0% 0.0% 411.000 100 Cost management efficiency ratios Profit margin (%) Gross marpin() Operating margin(%) 0.0% 0.0% 00% 0.0% 0.0% 0.0% 0.0% 0.0% 0.0% 12000 4000 40 8 BALANCE SHIT 9 10 11 ASSETS 12 Cat 13 Res. To 14 Tidl 15 Pales 16 C 17 18 Camel 19 20 Pet 21 Accedi 22 23 Putlo 24 25 bih 26 AO 27 28 Demap 29 Anne 30 31 MODAL ASSETS 32 33 LUBLITES 34 Aan 35 Neede 36 cod 37 Tone 38 Demi De la Corte 162.000 9.00 300 000 000 300 900 Asset management efficiency ratios Assat turnover times) Fored asset tumover times) Inventory tumover times) Inventory days (days) Acct. receivable days (days) Act payable days (days) Operating cycle (days) Cash conversion cycle days) Days' sales in cash (days) 0.0 00 0.0 0.0 00 0.0 00 0.0 0.0 0.0 00 00 00 0.0 0.0 00 0.0 00 888888888 000 19.000 000 2000 3000 100 20 000 10000 000 100 Financing efficiency Assets-to-equity times) Debt to assets (%) Debt to equity (%) Times interest and times) Current ratio times) Quick ratio times) 00 00% 0.0% 00 0.0 0.0 0.0 0.0% 0.0% 00 00 00 00 0.0% 0.0% 0.0 00 22.000 43 J1 100 200 100 0.000 100 40 41 Tools 2) Kohl's Target Nordstrom Macy's PROTECTED VIEW Be carefulfiles from the Internet can contain viruses. Unless F25 E x fx B D E 5,861.000 1,122.000 .000 1,662.000 .000 4,708.000 1,238.000 .000 1,580.000 .000 6,539.000 1,169.000 .000 1,337.000 .000 13,720.000 12,758.000 14,795.000 A 42 43 Long Term Debt 44 Deferred Taxes (Balance Sheet) 45 Investment Tax Credit 46 Liabilities - Other 47 Noncontrolling Interest - Redeemable 48 49 TOTAL LIABILITIES 50 51 SHAREHOLDERS' EQUITY 52 Preferred Stock 53 Common Stock 54 Capital Surplus 55 Retained Earnings (Net Other) 56 Less: Treasury Stock 57 Shareholders Equity - Parent 58 Noncontrolling Interest - Nonredeemable 59 60 TOTAL SHAREHOLDERS EQUITY .000 .000 3.000 676.000 6,450.000 1.456.000 5,673.000 -12.000 3.000 652.000 7,099.000 1.318.000 6,436.000 .000 .000 3.0001 621.000 6,994.000 1,241.000 6,377.000 .000 5,661.000 6,436.000 6,377.000 61 19,381.000 19,194.000 21.172.000 62 TOTAL LIABILITIES AND EQUITY 63 64 65 INCOME STATEMENT 66 67 68 Sales (Net) 69 Cost of Goods Sold 70 71 Gross Profit 72 Selling, General, & Admin Expenses Fiscal Year: (FYR Ending): 2017 (31JAN 2018) 24,837.000 14,161.000 2018 (31JAN2019) 25,739.000 14,253.000 2019 (31JAN2020) 25,331.000 14.190.000 10,676.000 8,302.000 11,486.000 9,039.000 11,141.000 9,229.000 73 1,912.000 2,374.000 991.000 2,447.000 962.000 981.000 1,383.000 332.000 566.000 -110.000 1,485.000 271.000 375.000 - 169.000 931.000 214.000 164.000 -153.000 74 Operating Income Before Depreciation (EBITDA) 75 Depreciation, Depletion, & Amortiz 76 77 Operating Income After Depreciation (EBIT) 78 Interest Expense 79 Non-Operating Income Expense 80 Special Items 81 82 Pretax Income 83 Income Taxes - Total 84 Minority Interest 85 Income Before EI&DO 86 Extraordinary Items 87 Discontinued Operations 1,507.000 -29.000 -11.000 1,547.000 .000 .000 1,420.000 322.000 -10.000 1.108.000 .000 .000 728.000 164.000 .000 564.000 .000 .000 88 1,108.000 564.000 89 Net Income (Loss) Kohl's Ready Target 1,547.000 Nordstrom Macy's F25 A C D 7 Macy's Industry ttvals (average) 2017 2013 2019 201 2017 2019 2019 GLASS) 10) GLA00 Return on Equity ROE (15) = 0.0% 0.0% 0.0% 120.000 200 19.00 22:00 9.00 100 Overall return on investment ratios (alternative to ROE ROA (%) ROIC 0.0% 00% 0.0% 0.0% 0.0% 0.0% 411.000 100 Cost management efficiency ratios Profit margin (%) Gross marpin() Operating margin(%) 0.0% 0.0% 00% 0.0% 0.0% 0.0% 0.0% 0.0% 0.0% 12000 4000 40 8 BALANCE SHIT 9 10 11 ASSETS 12 Cat 13 Res. To 14 Tidl 15 Pales 16 C 17 18 Camel 19 20 Pet 21 Accedi 22 23 Putlo 24 25 bih 26 AO 27 28 Demap 29 Anne 30 31 MODAL ASSETS 32 33 LUBLITES 34 Aan 35 Neede 36 cod 37 Tone 38 Demi De la Corte 162.000 9.00 300 000 000 300 900 Asset management efficiency ratios Assat turnover times) Fored asset tumover times) Inventory tumover times) Inventory days (days) Acct. receivable days (days) Act payable days (days) Operating cycle (days) Cash conversion cycle days) Days' sales in cash (days) 0.0 00 0.0 0.0 00 0.0 00 0.0 0.0 0.0 00 00 00 0.0 0.0 00 0.0 00 888888888 000 19.000 000 2000 3000 100 20 000 10000 000 100 Financing efficiency Assets-to-equity times) Debt to assets (%) Debt to equity (%) Times interest and times) Current ratio times) Quick ratio times) 00 00% 0.0% 00 0.0 0.0 0.0 0.0% 0.0% 00 00 00 00 0.0% 0.0% 0.0 00 22.000 43 J1 100 200 100 0.000 100 40 41 Tools 2) Kohl's Target Nordstrom Macy's PROTECTED VIEW Be carefulfiles from the Internet can contain viruses. Unless F25 E x fx B D E 5,861.000 1,122.000 .000 1,662.000 .000 4,708.000 1,238.000 .000 1,580.000 .000 6,539.000 1,169.000 .000 1,337.000 .000 13,720.000 12,758.000 14,795.000 A 42 43 Long Term Debt 44 Deferred Taxes (Balance Sheet) 45 Investment Tax Credit 46 Liabilities - Other 47 Noncontrolling Interest - Redeemable 48 49 TOTAL LIABILITIES 50 51 SHAREHOLDERS' EQUITY 52 Preferred Stock 53 Common Stock 54 Capital Surplus 55 Retained Earnings (Net Other) 56 Less: Treasury Stock 57 Shareholders Equity - Parent 58 Noncontrolling Interest - Nonredeemable 59 60 TOTAL SHAREHOLDERS EQUITY .000 .000 3.000 676.000 6,450.000 1.456.000 5,673.000 -12.000 3.000 652.000 7,099.000 1.318.000 6,436.000 .000 .000 3.0001 621.000 6,994.000 1,241.000 6,377.000 .000 5,661.000 6,436.000 6,377.000 61 19,381.000 19,194.000 21.172.000 62 TOTAL LIABILITIES AND EQUITY 63 64 65 INCOME STATEMENT 66 67 68 Sales (Net) 69 Cost of Goods Sold 70 71 Gross Profit 72 Selling, General, & Admin Expenses Fiscal Year: (FYR Ending): 2017 (31JAN 2018) 24,837.000 14,161.000 2018 (31JAN2019) 25,739.000 14,253.000 2019 (31JAN2020) 25,331.000 14.190.000 10,676.000 8,302.000 11,486.000 9,039.000 11,141.000 9,229.000 73 1,912.000 2,374.000 991.000 2,447.000 962.000 981.000 1,383.000 332.000 566.000 -110.000 1,485.000 271.000 375.000 - 169.000 931.000 214.000 164.000 -153.000 74 Operating Income Before Depreciation (EBITDA) 75 Depreciation, Depletion, & Amortiz 76 77 Operating Income After Depreciation (EBIT) 78 Interest Expense 79 Non-Operating Income Expense 80 Special Items 81 82 Pretax Income 83 Income Taxes - Total 84 Minority Interest 85 Income Before EI&DO 86 Extraordinary Items 87 Discontinued Operations 1,507.000 -29.000 -11.000 1,547.000 .000 .000 1,420.000 322.000 -10.000 1.108.000 .000 .000 728.000 164.000 .000 564.000 .000 .000 88 1,108.000 564.000 89 Net Income (Loss) Kohl's Ready Target 1,547.000 Nordstrom Macy's
Step by Step Solution
There are 3 Steps involved in it

Get step-by-step solutions from verified subject matter experts