

Question: f3. Linear Regression. The line which fits the points (1,3) (2, -2) (3, -1) (4, -5) using linear regression is -2.3x + 4.5. These points
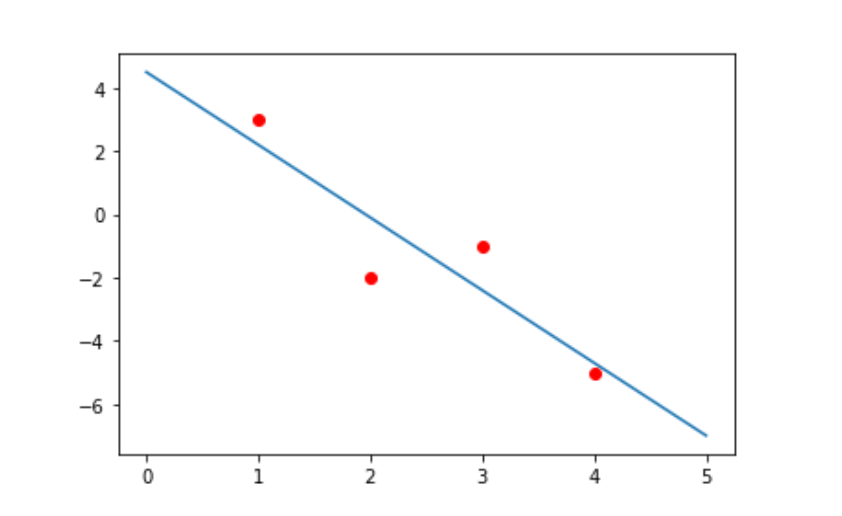
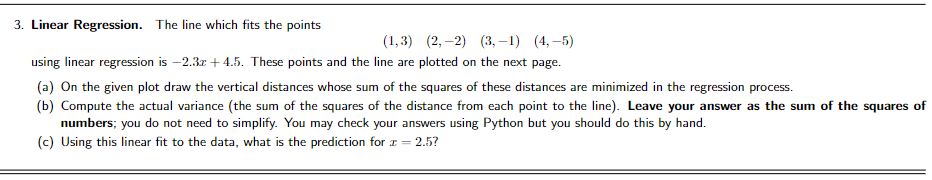
\f3. Linear Regression. The line which fits the points (1,3) (2, -2) (3, -1) (4, -5) using linear regression is -2.3x + 4.5. These points and the line are plotted on the next page. (a) On the given plot draw the vertical distances whose sum of the squares of these distances are minimized in the regression process. (b) Compute the actual variance (the sum of the squares of the distance from each point to the line). Leave your answer as the sum of the squares of numbers; you do not need to simplify. You may check your answers using Python but you should do this by hand. (c) Using this linear fit to the data, what is the prediction for c = 2.5
Step by Step Solution
There are 3 Steps involved in it

Get step-by-step solutions from verified subject matter experts