

Question: fA data set is given below. (a) Draw a scatter diagram. Comment on the type of relation that appears to exist between x and y.
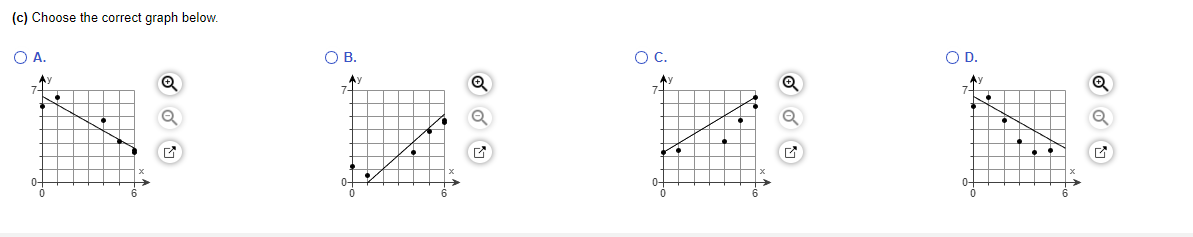


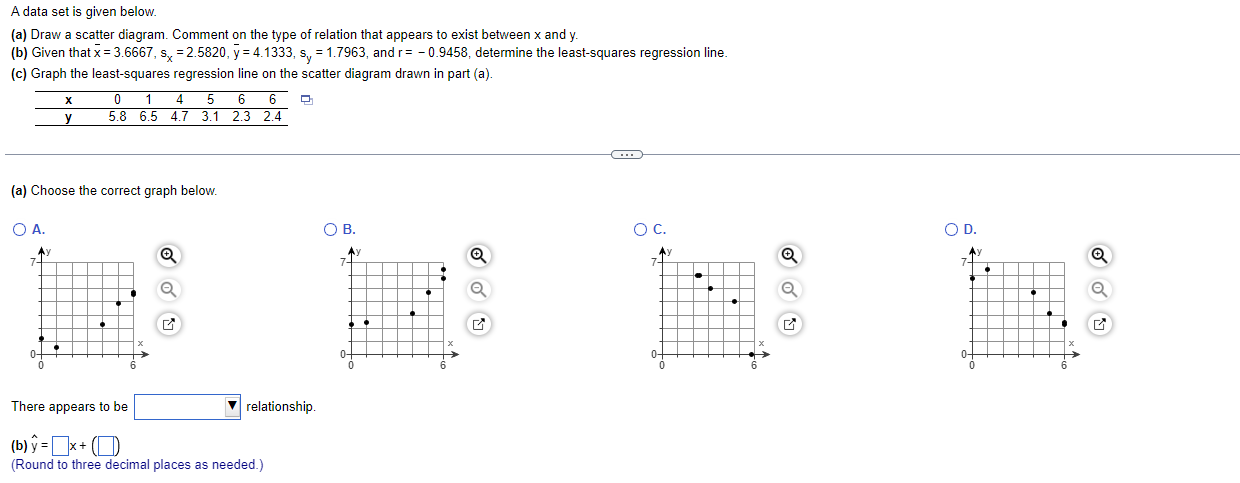
\fA data set is given below. (a) Draw a scatter diagram. Comment on the type of relation that appears to exist between x and y. (b) Given that x = 3.6667, s, = 2.5820, y = 4.1333, s, = 1.7963, and r= - 0.9458, determine the least-squares regression line. (c) Graph the least-squares regression line on the scatter diagram drawn in part (a). X 0 1 4 5 6 6 5 y 5.8 6.5 4.7 3.1 2.3 2.4 (a) Choose the correct graph below. O A. OB. O C. OD. Ay 71 X There appears to be relationship. (b) y = _x + (0) (Round to three decimal places as needed.)
Step by Step Solution
There are 3 Steps involved in it
1 Expert Approved Answer
Step: 1 Unlock

Question Has Been Solved by an Expert!
Get step-by-step solutions from verified subject matter experts
Step: 2 Unlock
Step: 3 Unlock