

Question: fa) Filter the data to focus on unemployed Canadians. Using the sample data, construct a relative frequency distribution of unemployed Canadians by province. b) Create
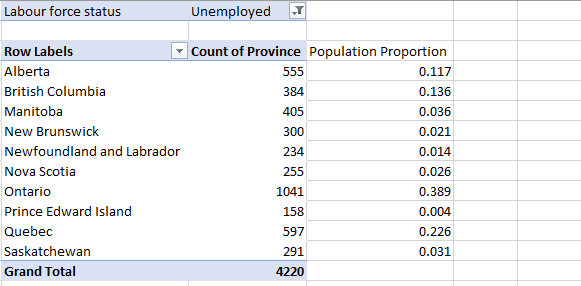
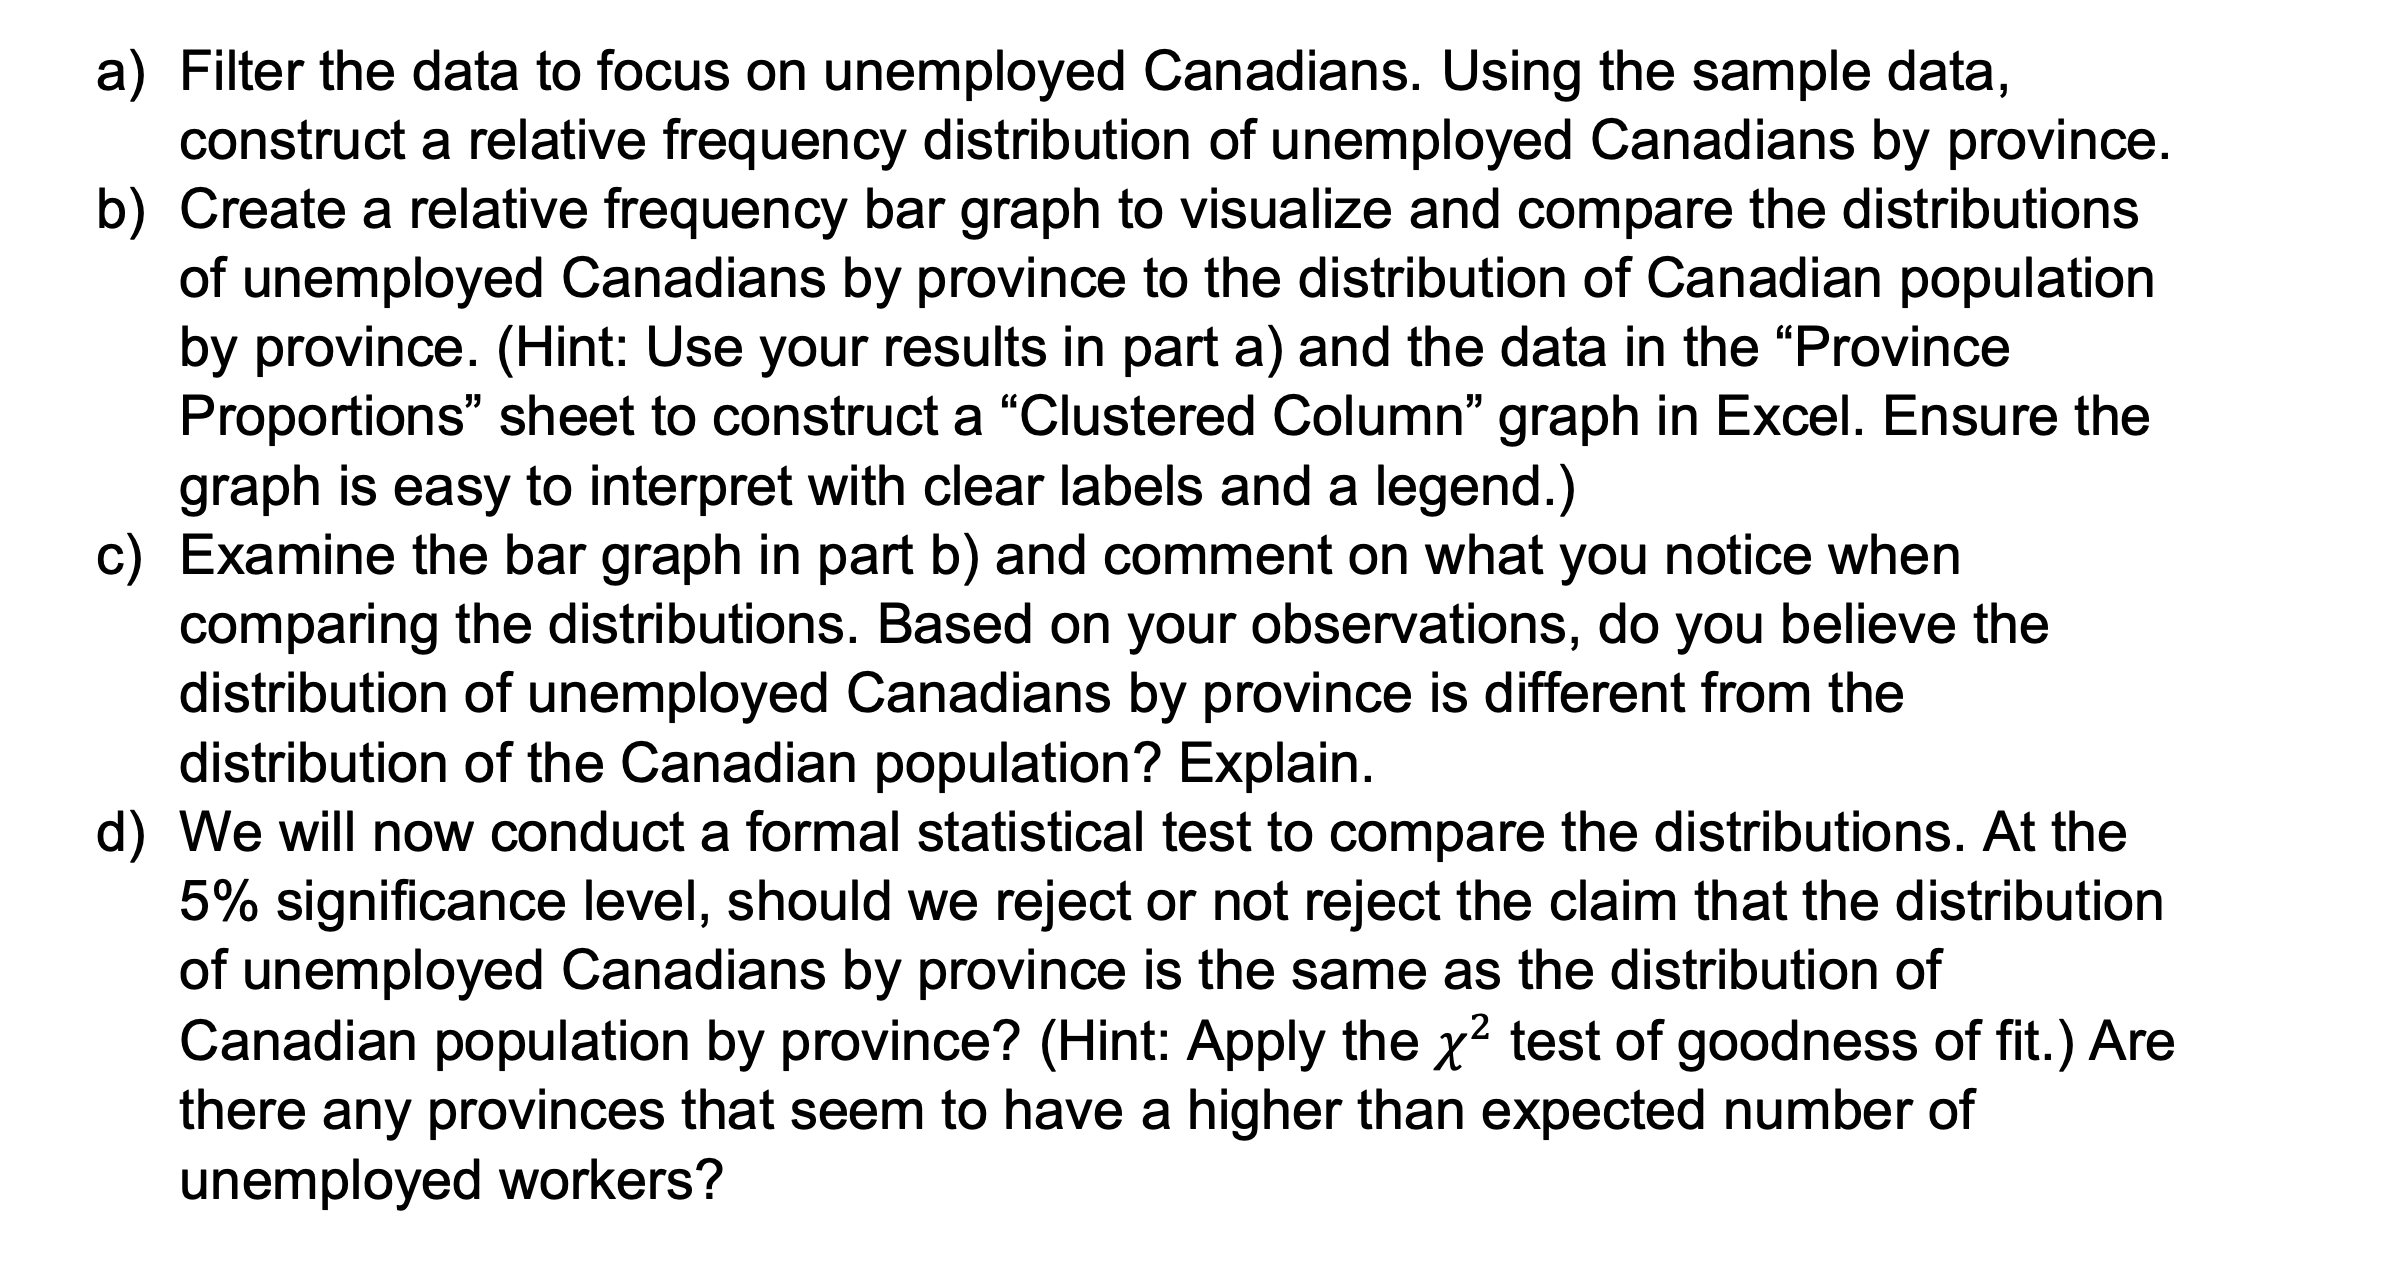
\fa) Filter the data to focus on unemployed Canadians. Using the sample data, construct a relative frequency distribution of unemployed Canadians by province. b) Create a relative frequency bar graph to visualize and compare the distributions of unemployed Canadians by province to the distribution of Canadian population by province. (Hint: Use your results in part a) and the data in the \"Province Proportions\" sheet to construct a \"Clustered Column\" graph in Excel. Ensure the graph is easy to interpret with clear labels and a legend.) c) Examine the bar graph in part b) and comment on what you notice when comparing the distributions. Based on your observations, do you believe the distribution of unemployed Canadians by province is different from the distribution of the Canadian population? Explain. d) We will now conduct a formal statistical test to compare the distributions. At the 5% signicance level, should we reject or not reject the claim that the distribution of unemployed Canadians by province is the same as the distribution of Canadian population by province? (Hint: Apply the x2 test of goodness of fit.) Are there any provinces that seem to have a higher than expected number of unemployed workers
Step by Step Solution
There are 3 Steps involved in it

Get step-by-step solutions from verified subject matter experts