

Question: fa) Write a frequency table that captures all the information from the histogram, then use it as needed to calculate the following: mean (M), mean


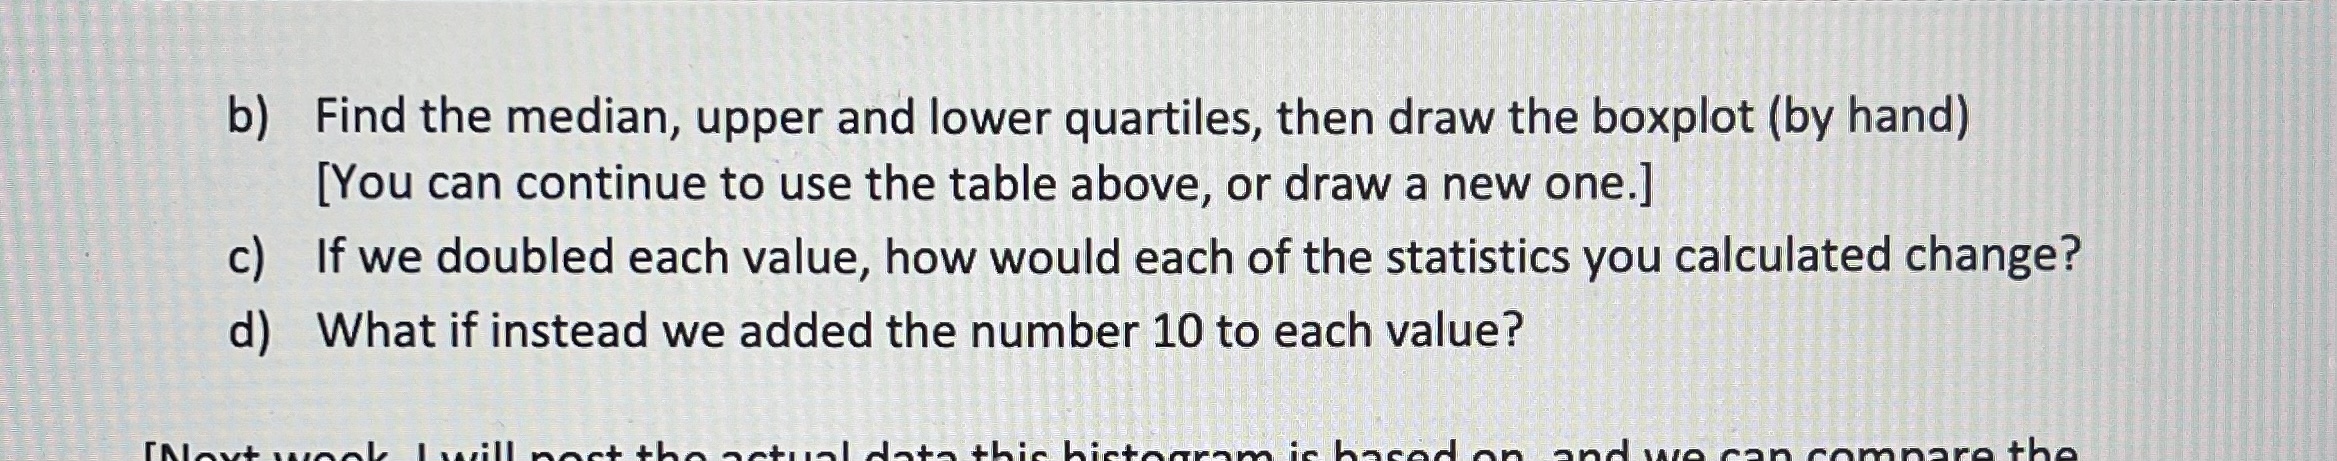

![draw a new one.] c) If we doubled each value, how would](https://s3.amazonaws.com/si.experts.images/answers/2024/06/6679d24e64742_7266679d24e0b16e.jpg)
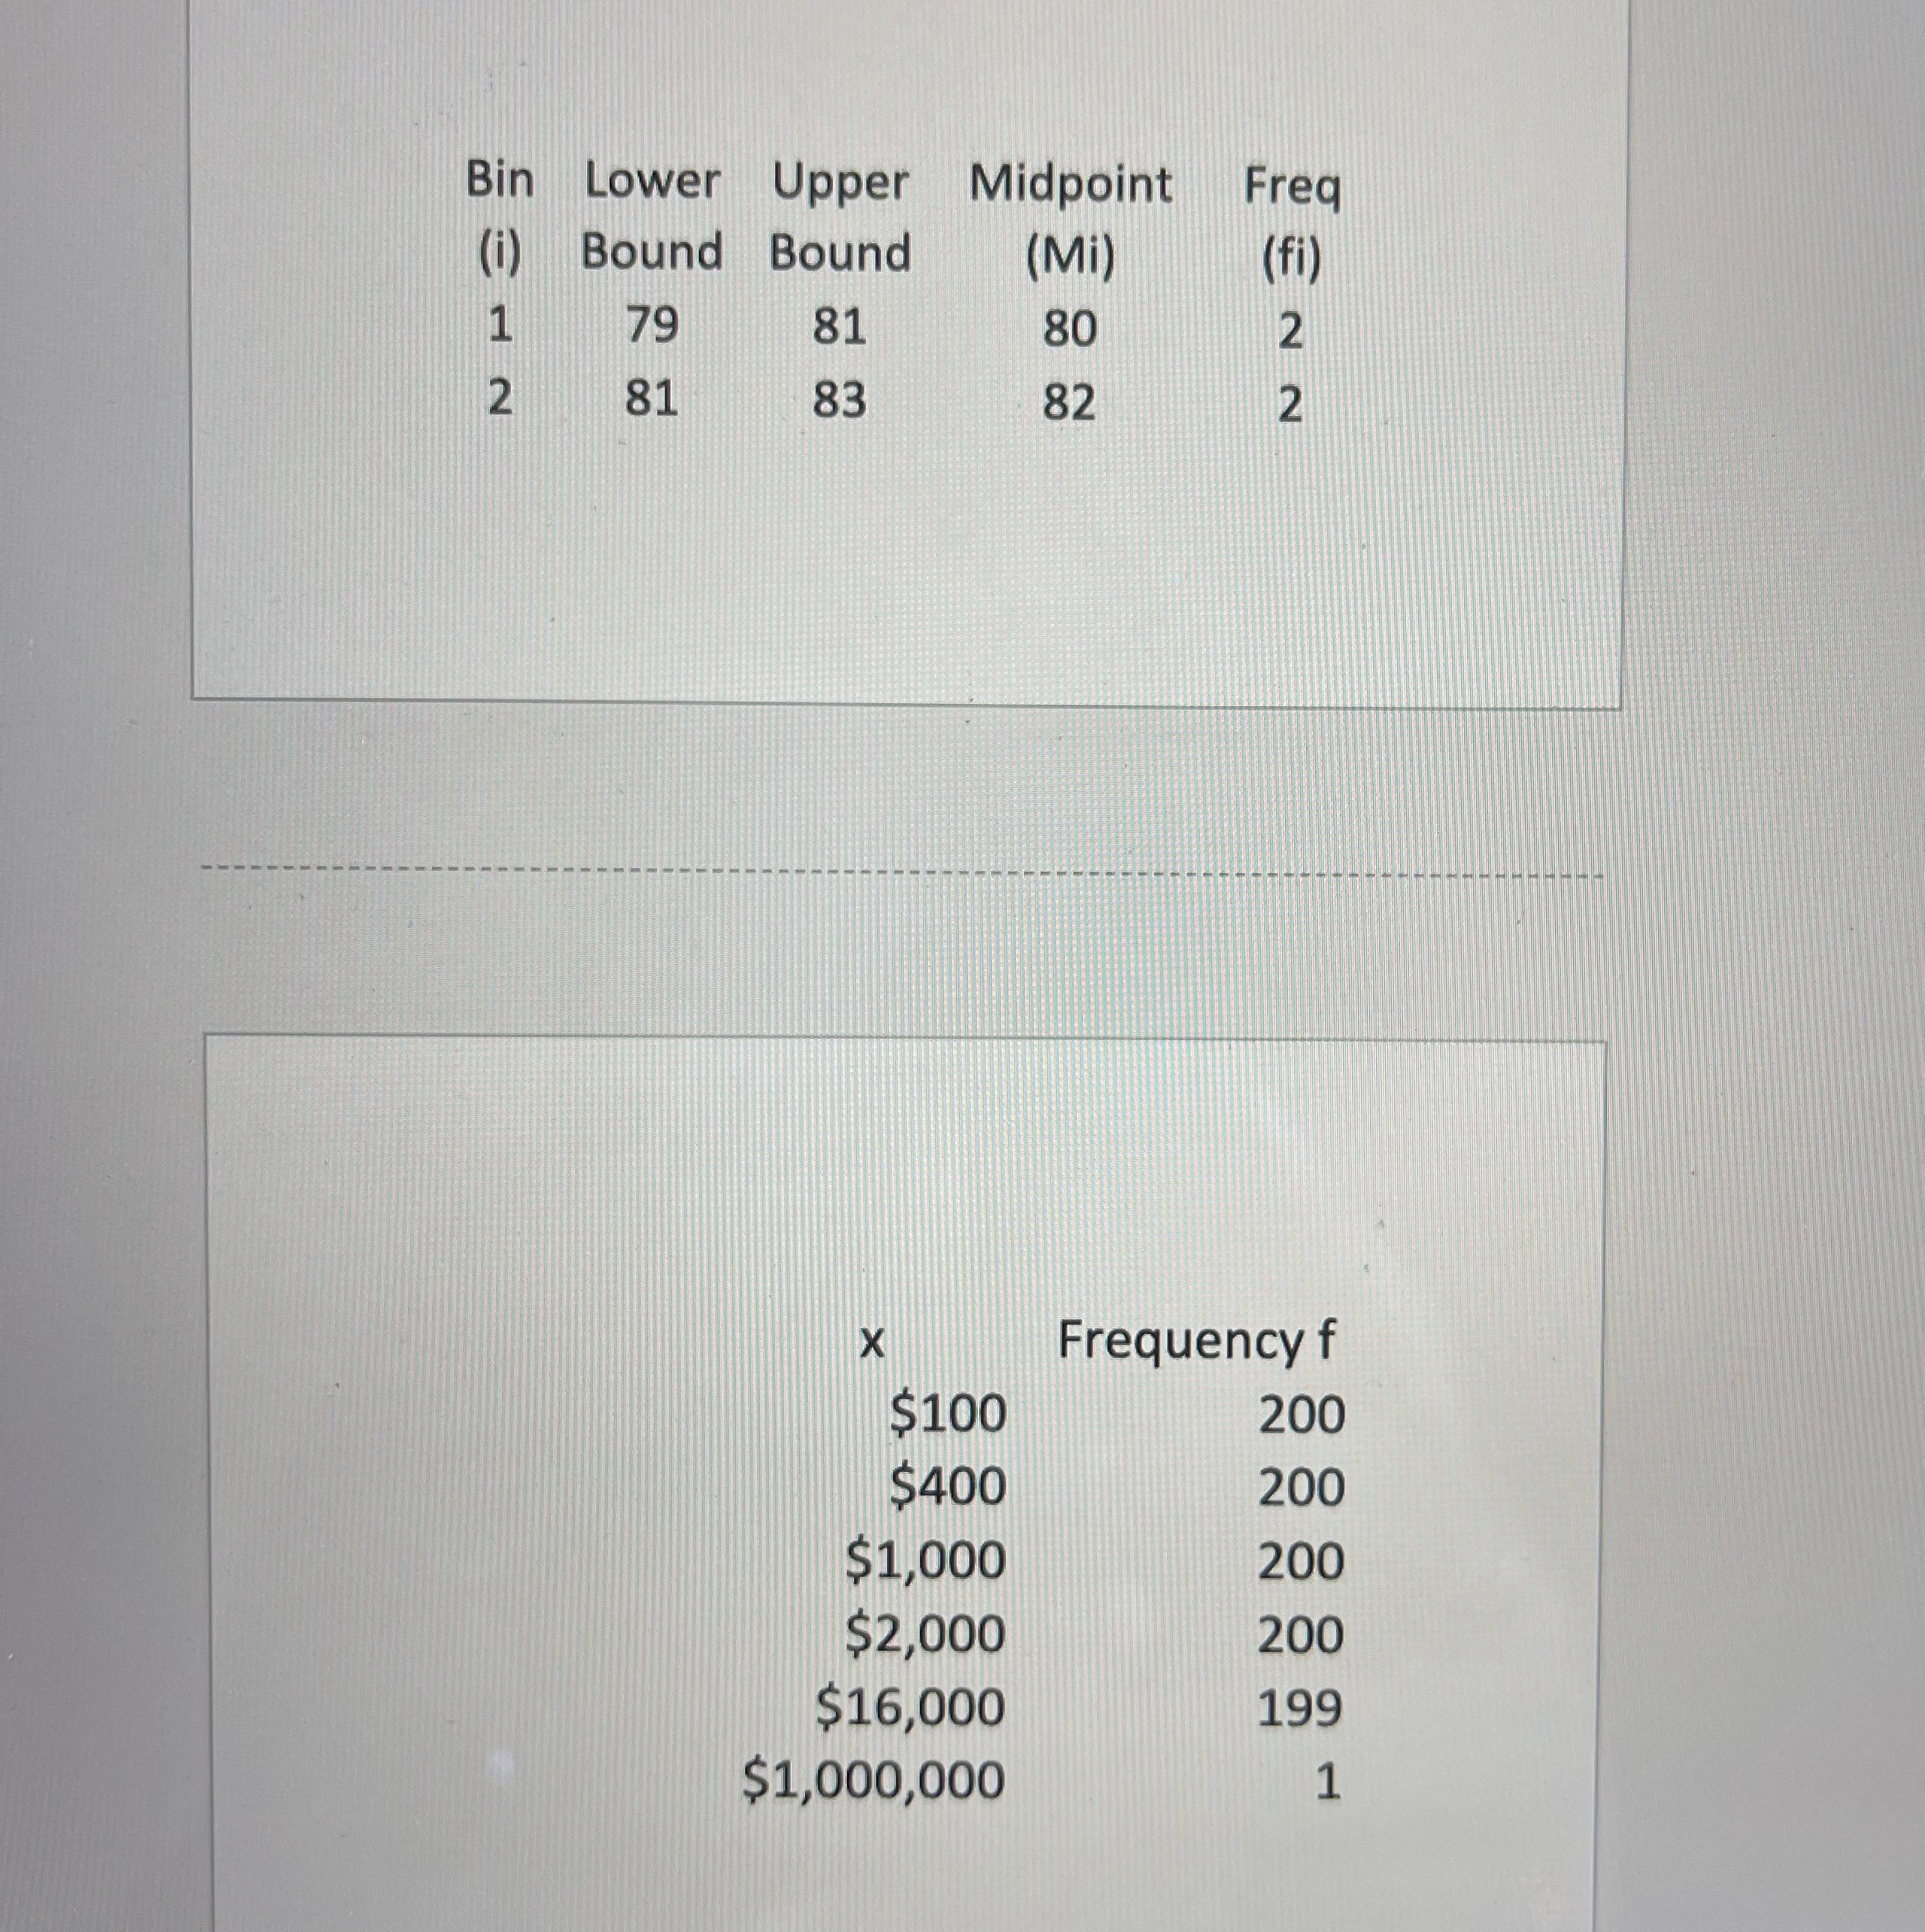
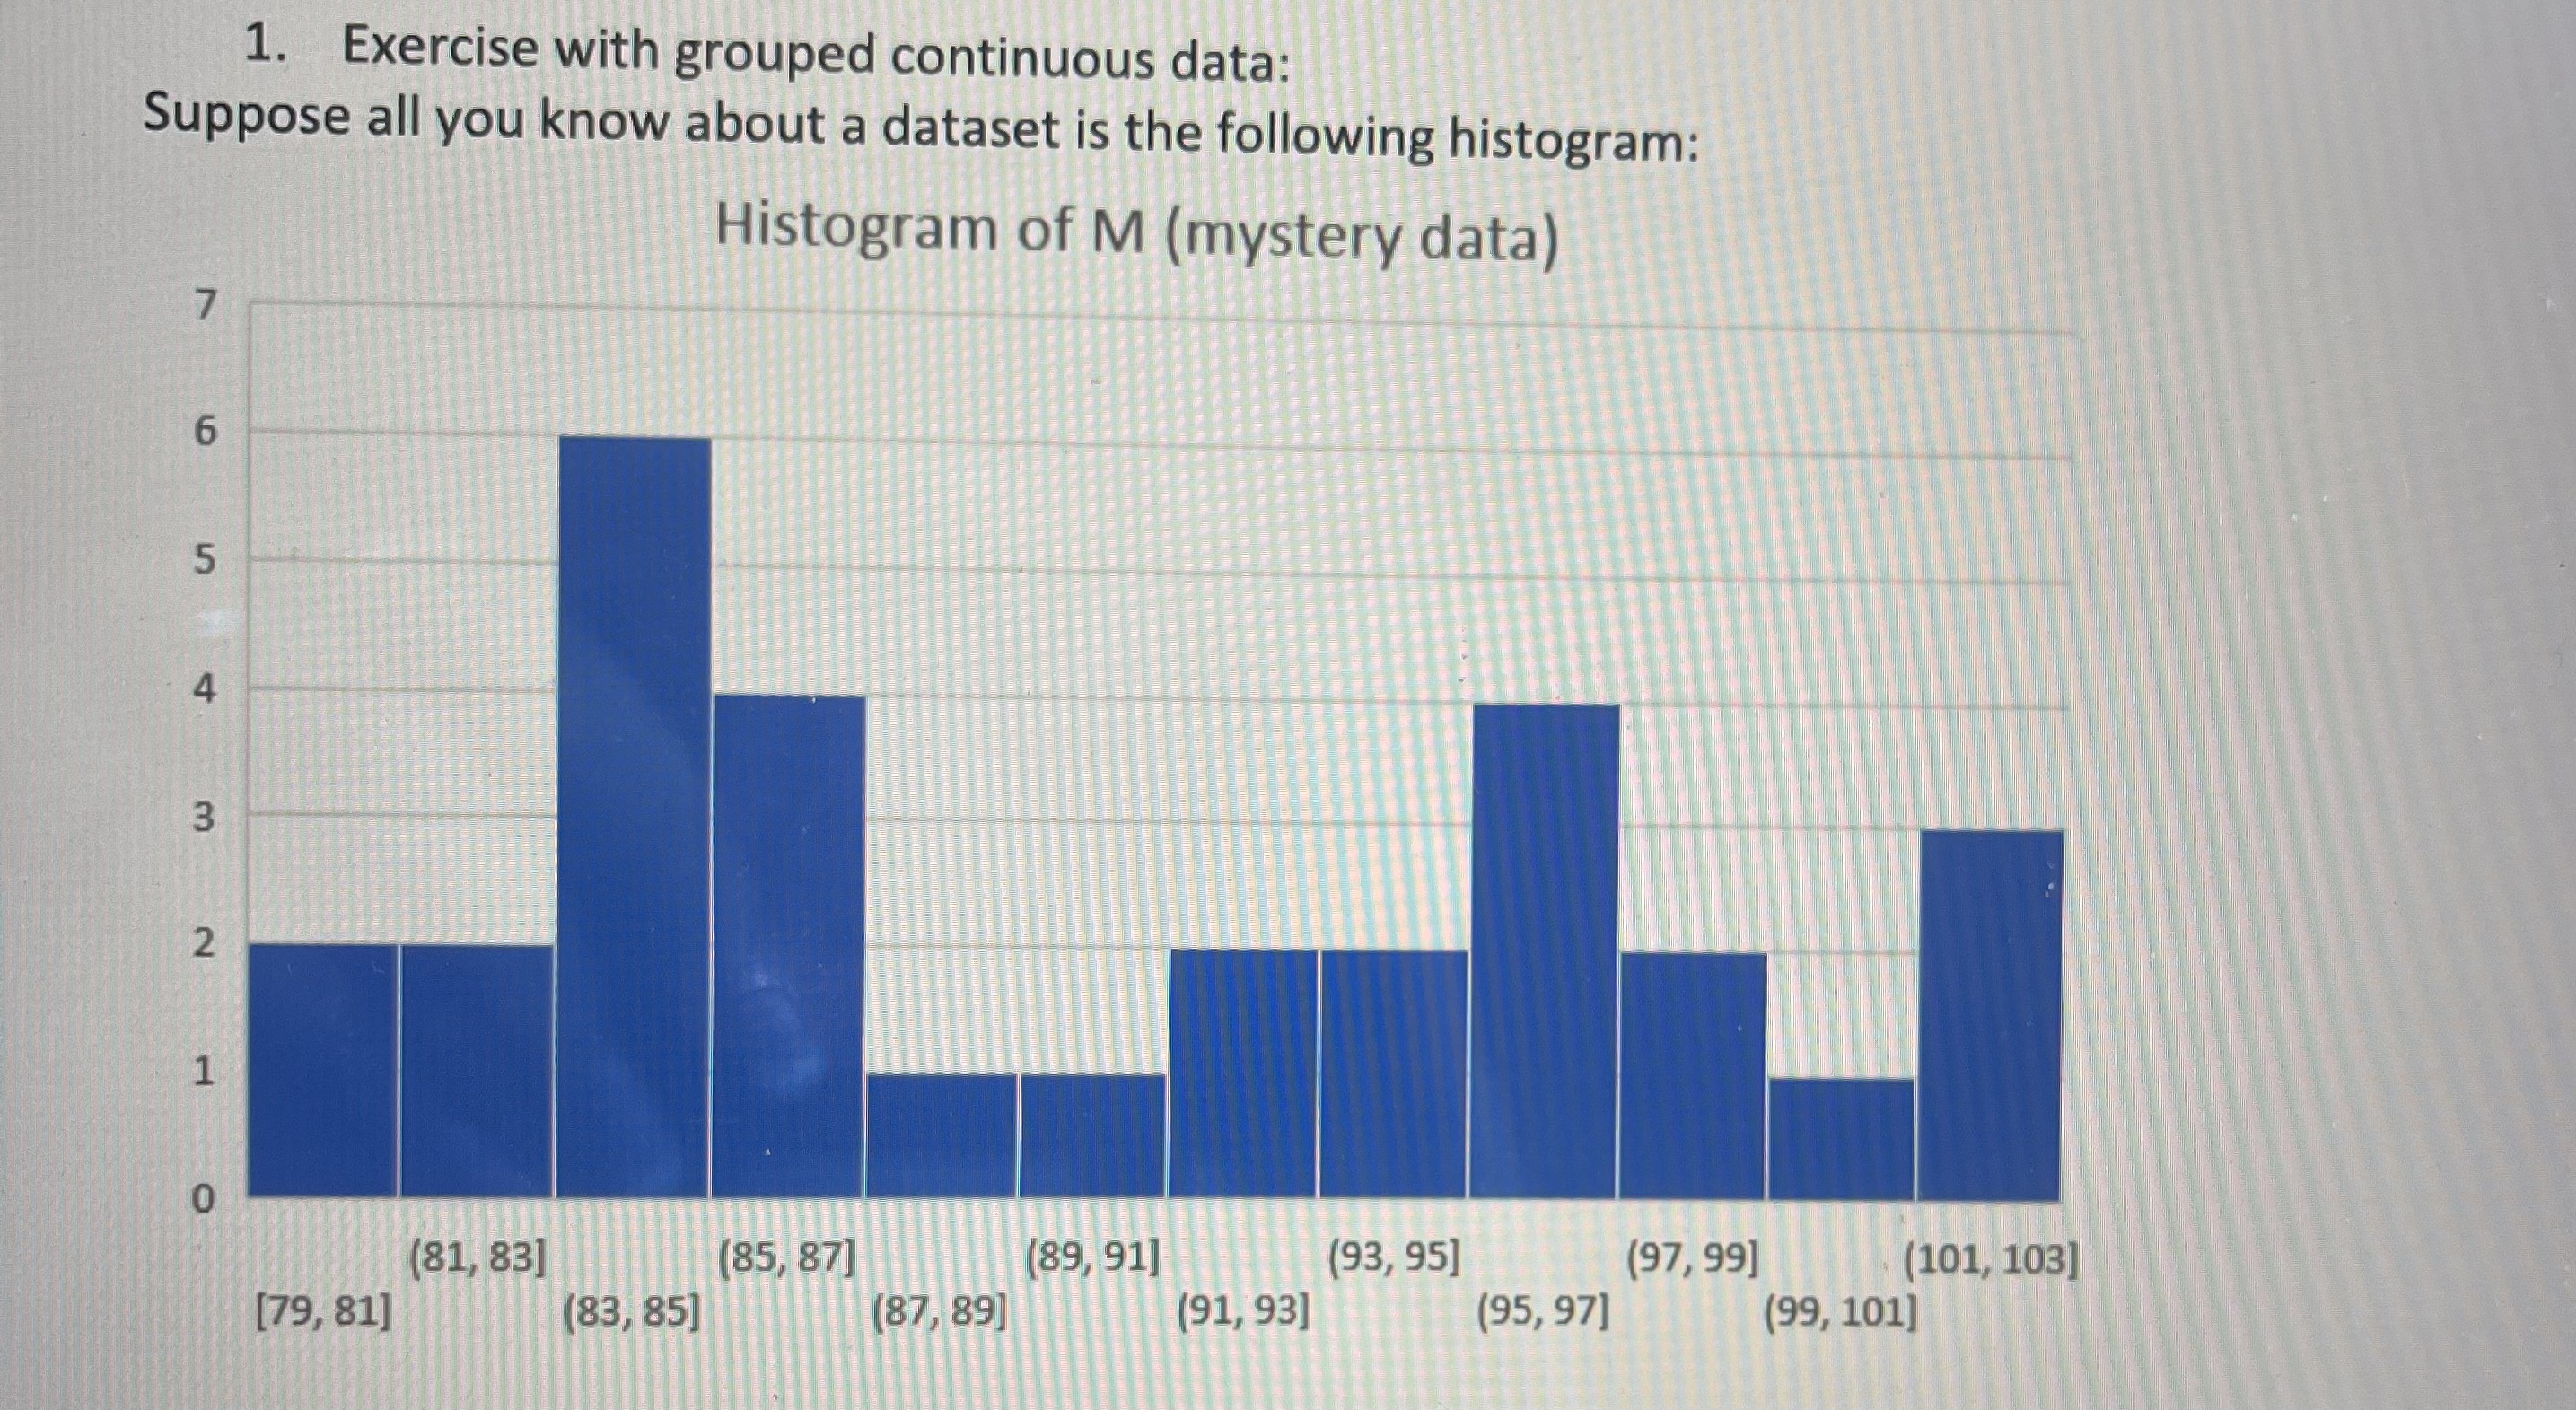
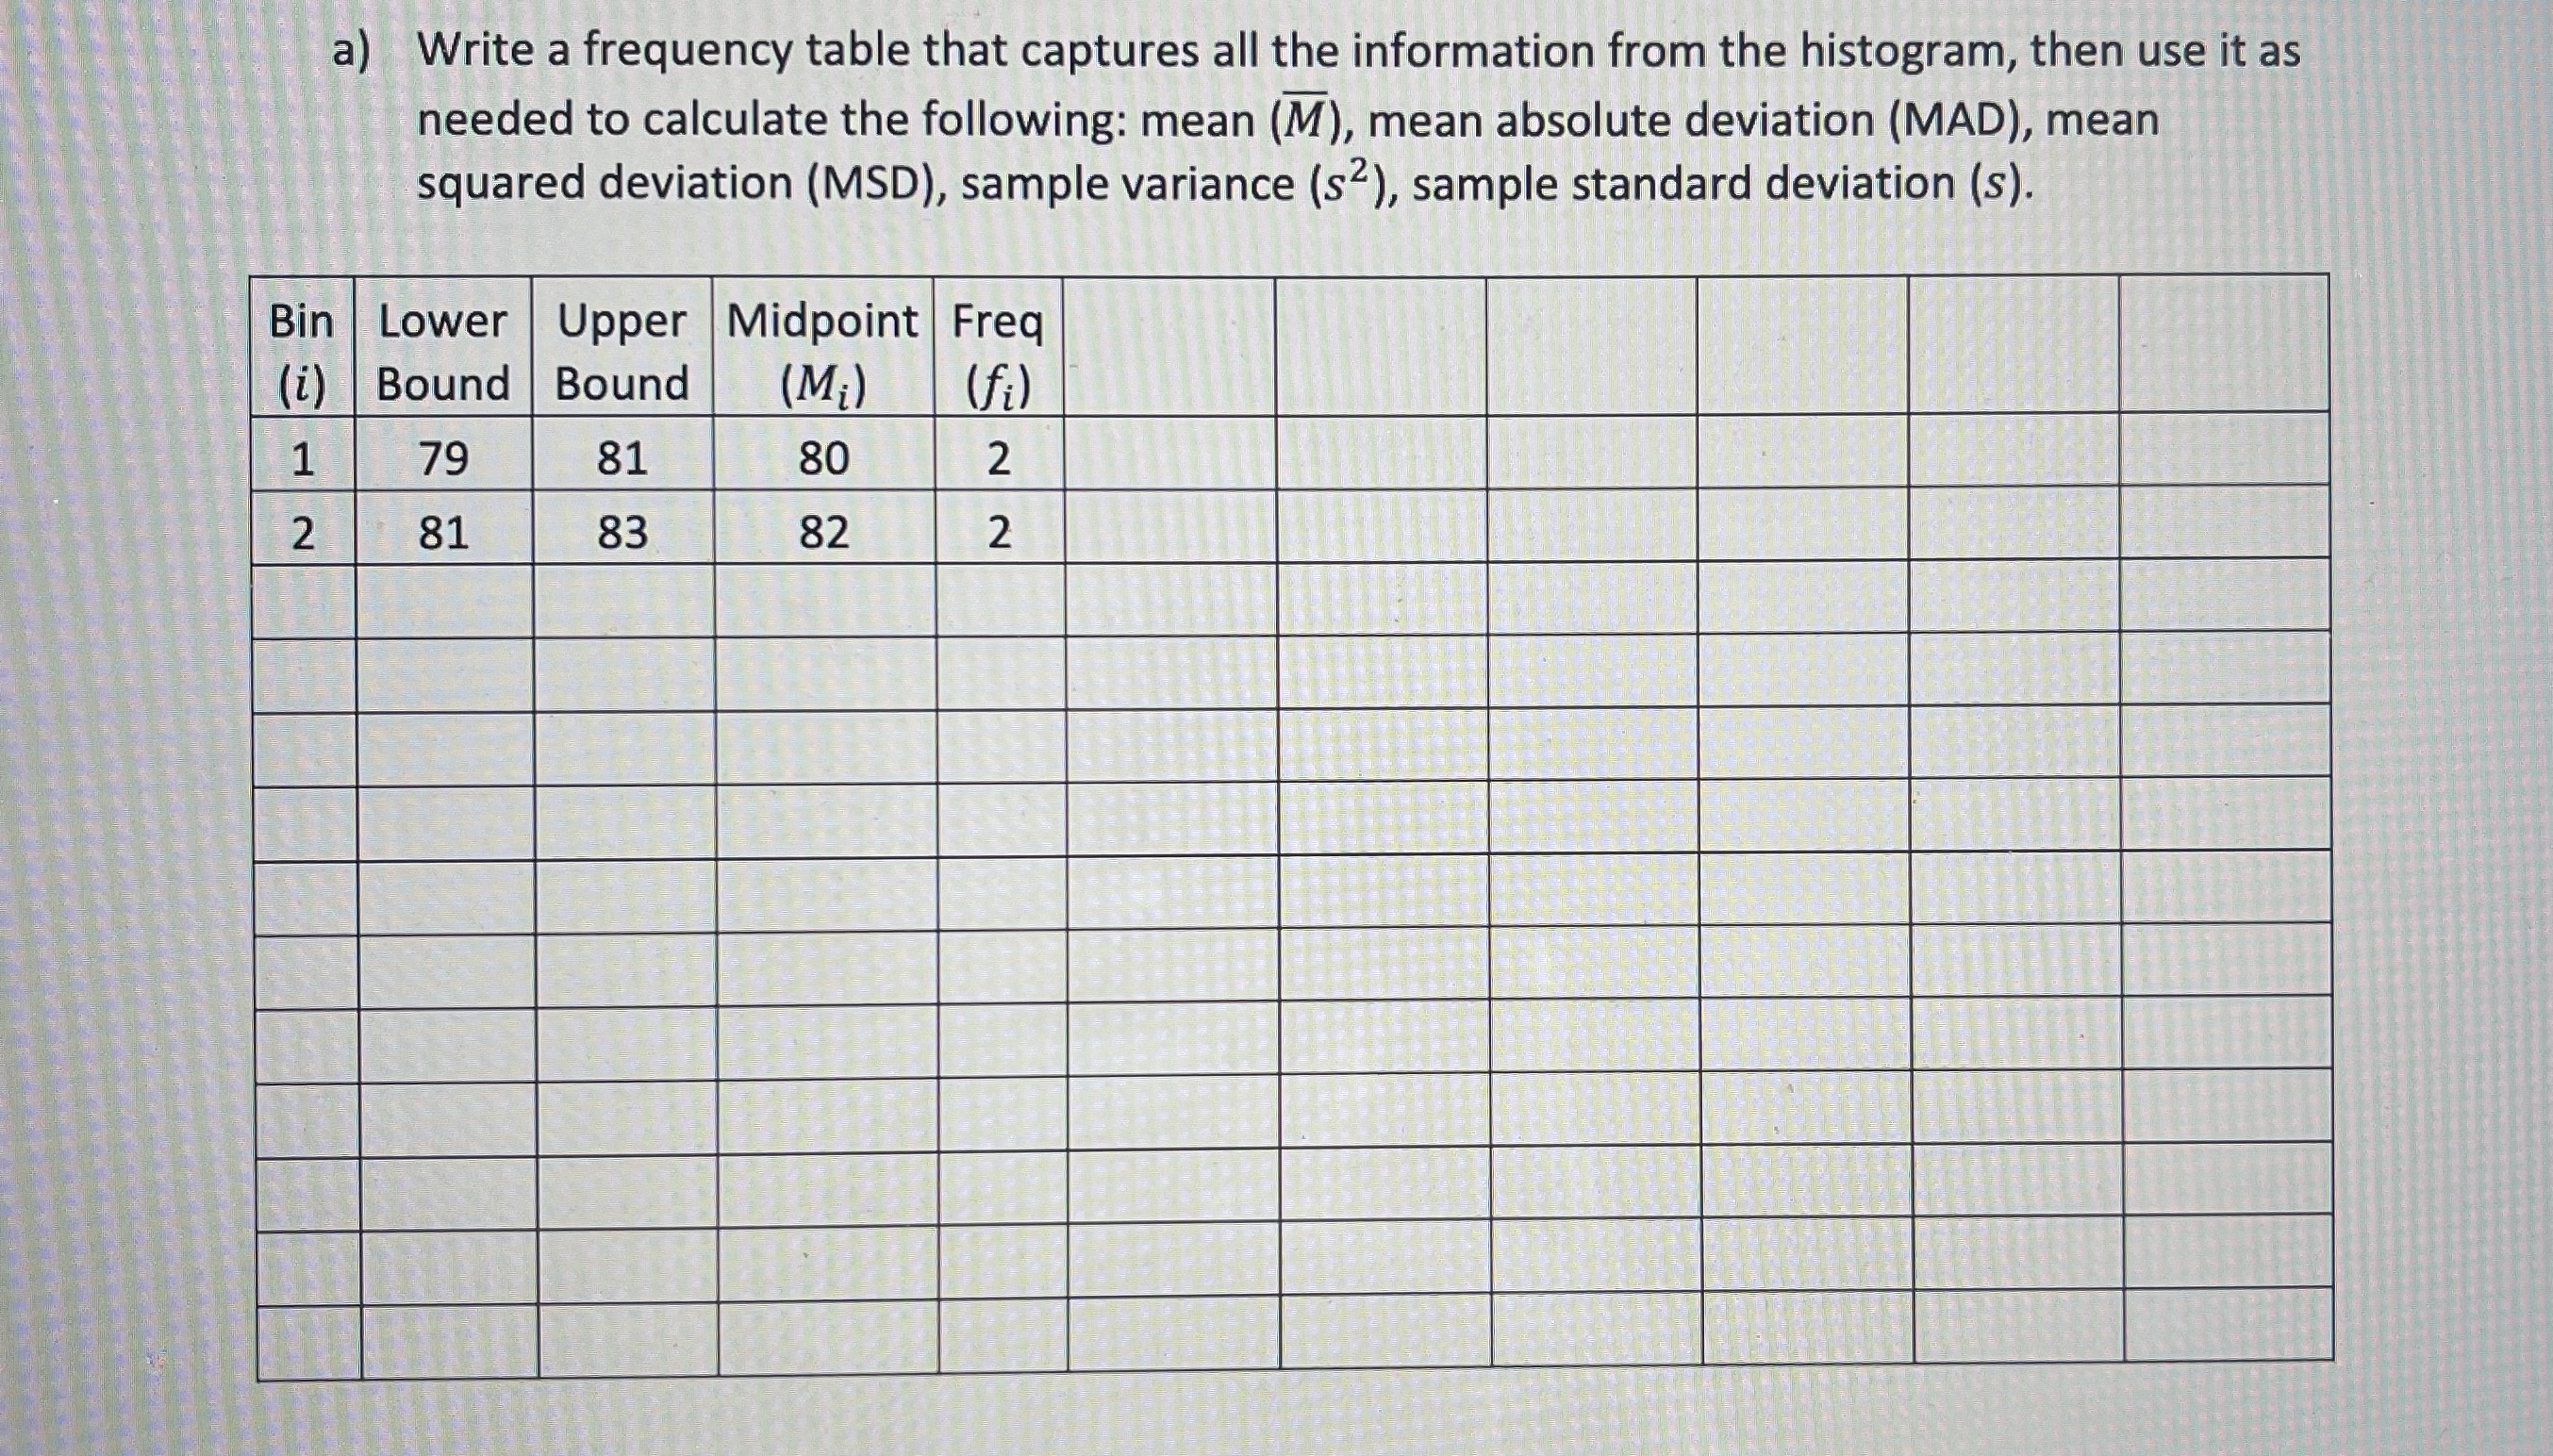
\fa) Write a frequency table that captures all the information from the histogram, then use it as needed to calculate the following: mean (M), mean absolute deviation (MAD), mean squared deviation (MSD), sample variance (s2), sample standard deviation (s). Bin Lower Upper Midpoint Freq (i) Bound Bound (Mi) ( fi ) 1 79 81 80 2 2 81 83 82 2b) Find the median, upper and lower quartiles, then draw the boxplot (by hand) [You can continue to use the table above, or draw a new one.] c) If we doubled each value, how would each of the statistics you calculated change? d) What if instead we added the number 10 to each value? TAL
Step by Step Solution
There are 3 Steps involved in it
1 Expert Approved Answer
Step: 1 Unlock

Question Has Been Solved by an Expert!
Get step-by-step solutions from verified subject matter experts
Step: 2 Unlock
Step: 3 Unlock