

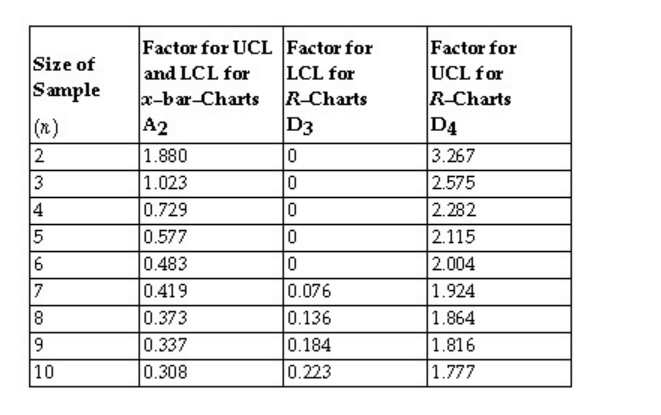
Question: Factors for Calculating Three - Sigma Limits for the Chart and R - Chart. table [ [ table [ [ Size of ]
Factors for Calculating ThreeSigma Limits for the Chart and RChart. tabletableSize ofSamplentableFactor for UCLand LCL forxbarChartsAtableFactor forLCL forRChartsDtableFactor forUCL forRChartsDtableSample Sample Sample Sample Sample Unit Unit Unit Unit Unit Unit Thermostats are subjected to rigorous testing before they are shipped to air conditioning technicians around the world. Results from the last five samples are shown in the table. Calculate control limits for a chart that will monitor process consistency. The correct control limits as LCLUCL are:
Question options:
A
B
C
D
E
Step by Step Solution
There are 3 Steps involved in it
1 Expert Approved Answer
Step: 1 Unlock

Question Has Been Solved by an Expert!
Get step-by-step solutions from verified subject matter experts
Step: 2 Unlock
Step: 3 Unlock