

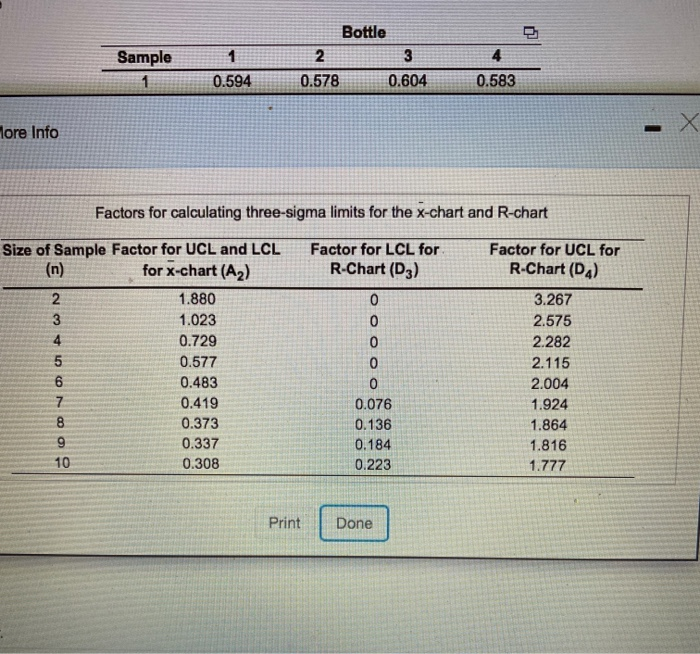
Question: the 1st table is question 28 and the 2nd table is for question 30 Problem 30 HW Score: 24.81%, 9.92 of 40 pt Aspen Plastic
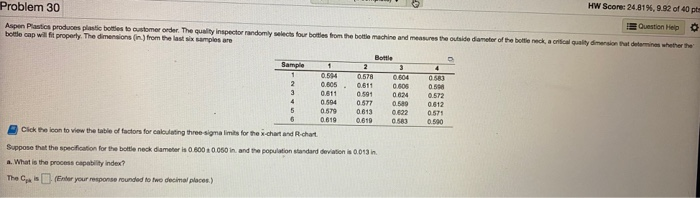
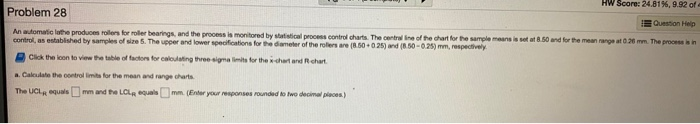
the 1st table is question 28 and the 2nd table is for question 30 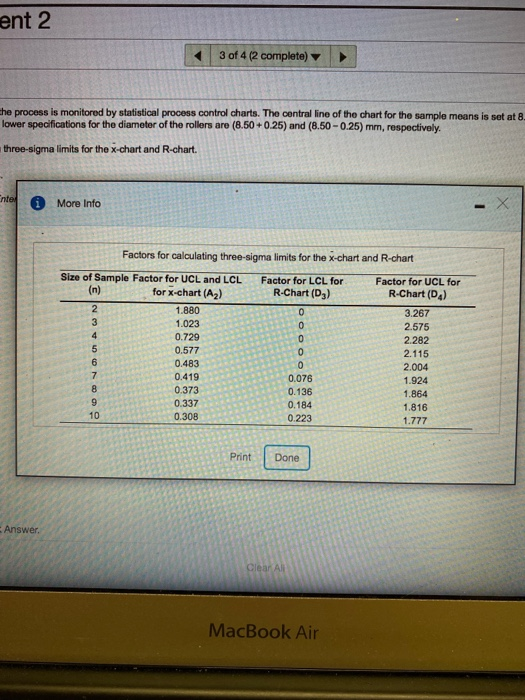
Step by Step Solution
There are 3 Steps involved in it
1 Expert Approved Answer
Step: 1 Unlock

Question Has Been Solved by an Expert!
Get step-by-step solutions from verified subject matter experts
Step: 2 Unlock
Step: 3 Unlock