

Question: Factors for Calculating Three-Sigma Limits for the Chart and R-Chart Factor for Factors Factors Size of UCL and for LCL for UCL LCL for x-
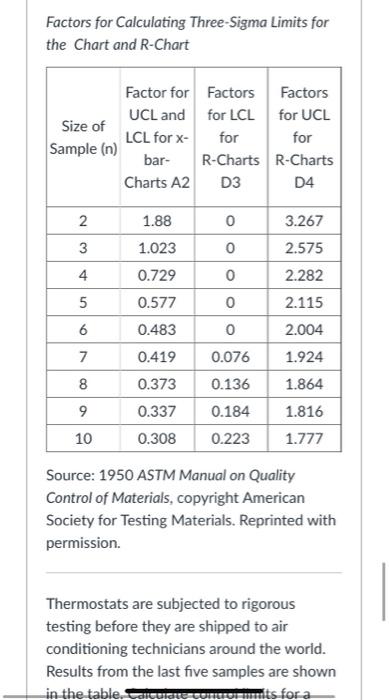
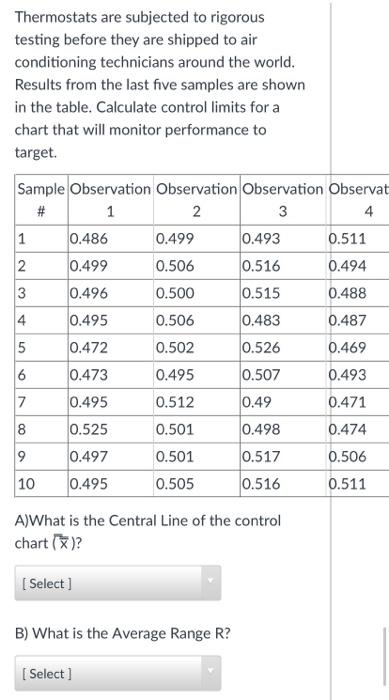
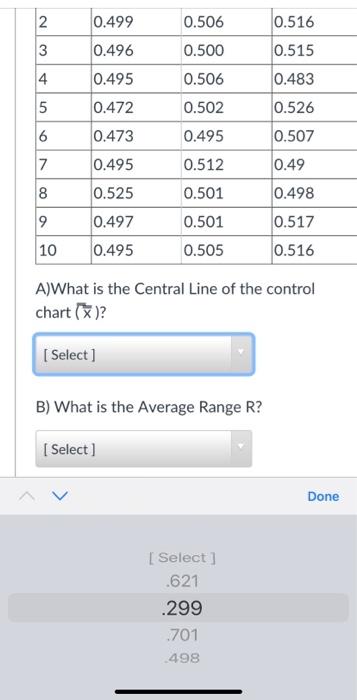
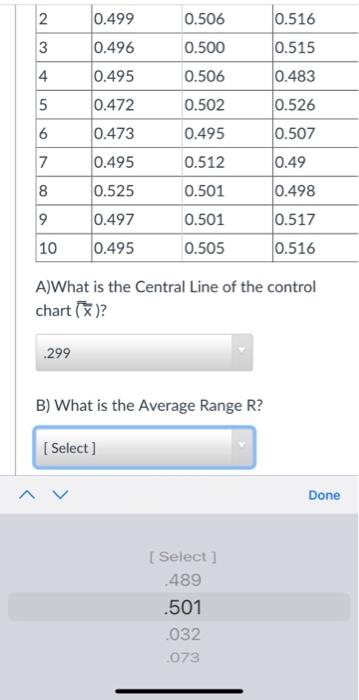
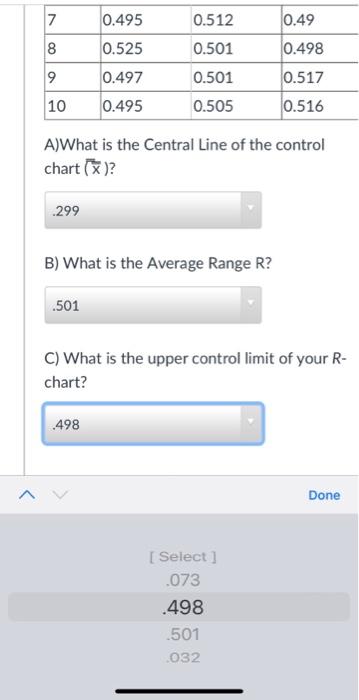
Factors for Calculating Three-Sigma Limits for the Chart and R-Chart Factor for Factors Factors Size of UCL and for LCL for UCL LCL for x- for for Sample (n) bar- R-Charts R-Charts Charts A2 D3 D4 2 2 1.88 0 3.267 3 1.023 2.575 4 2.282 5 5 6 0.729 0.577 0.483 0.419 0 0 0 0 0.076 0.136 0.184 0.223 2.115 2.004 1.924 7 8 1.864 9 0.373 0.337 0.308 1.816 1.777 10 Source: 1950 ASTM Manual on Quality Control of Materials, copyright American Society for Testing Materials. Reprinted with permission. Thermostats are subjected to rigorous testing before they are shipped to air conditioning technicians around the world. Results from the last five samples are shown in the table. CalculaTE-CONFts for a Thermostats are subjected to rigorous testing before they are shipped to air conditioning technicians around the world. Results from the last five samples are shown in the table. Calculate control limits for a chart that will monitor performance to target. Sample Observation Observation Observation Observat # 1 2 3 4 1 0.486 0.499 0.493 0.511 0.499 0.506 0.516 0.494 N 3 0.496 0.500 0.488 0.515 0.483 4 0.495 0.506 0.487 5 0.472 0.526 0.469 6 6 0.473 0.502 0.495 0.512 0.507 0.493 7 0.495 0.49 0.471 8 8 0.525 0.501 0.498 0.474 0.506 9 0.497 0.501 0.517 0.516 10 0.495 0.505 0.511 A)What is the Central Line of the control chart()? [Select] B) What is the Average Range R? [Select] 2 0.499 0.506 0.516 3 0.496 0.500 0.515 4 0.495 0.506 0.483 LO 0.472 0.526 0.502 0.495 6 0.473 0.507 7 0.495 0.512 0.49 8 0.525 0.501 0.498 9 0.497 0.517 0.501 0.505 10 0.495 0.516 A)What is the Central Line of the control chart (x)? [Select] B) What is the Average Range R? [ Select ] Done [ Select] .621 .299 .701 498 0.499 0.506 0.516 2. 3 4 0.496 0.500 0.515 0.483 4 0.495 0.472 0.506 0.502 5 un 0.526 6 6 0.473 0.495 0.507 7 0.495 0.512 0.49 8 0.525 0.501 0.498 9 0.497 0.517 0.501 0.505 10 0.495 0.516 A)What is the Central Line of the control chart (x)? .299 B) What is the Average Range R? [Select] Done [ Select] 489 .501 032 073 7 0.49 0.495 0.525 8 0.498 0.512 0.501 0.501 0.505 9 0.497 0.517 10 0.495 0.516 A)What is the Central Line of the control chart (x)? .299 B) What is the Average Range R? .501 C) What is the upper control limit of your R- chart? .498 Done [ Select] .073 .498 -501 032
Step by Step Solution
There are 3 Steps involved in it

Get step-by-step solutions from verified subject matter experts