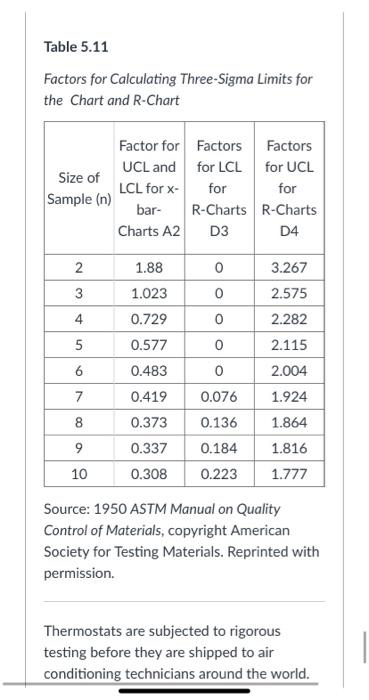
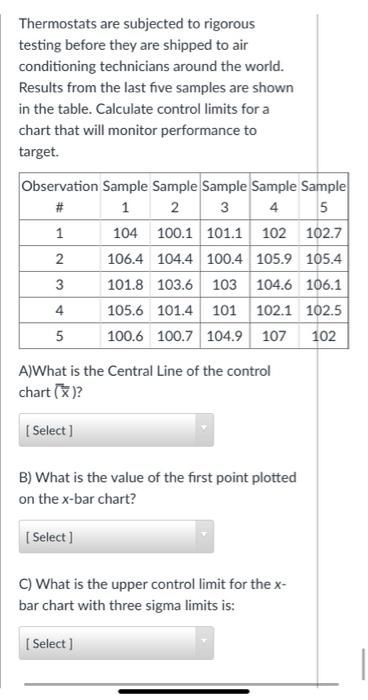
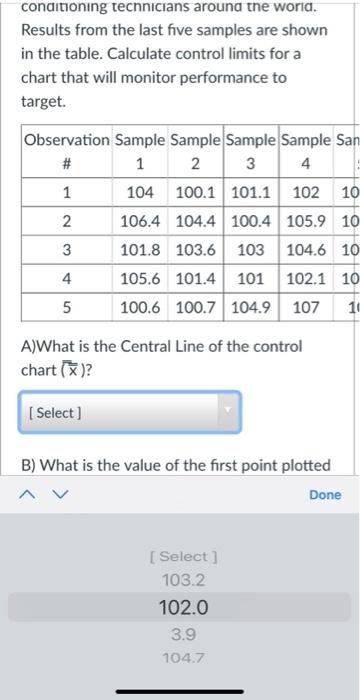
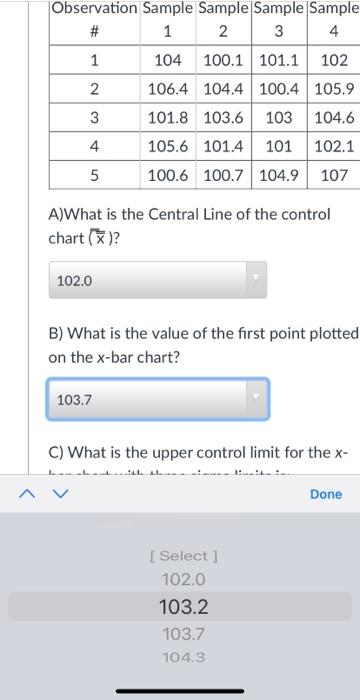
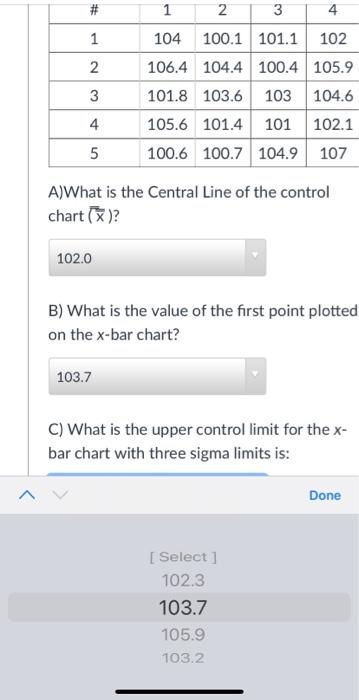
Question: Table 5.11 Factors for Calculating Three-Sigma Limits for the Chart and R-Chart Factor for Factors Factors Size of UCL and for LCL for UCL LCL

Table 5.11 Factors for Calculating Three-Sigma
Table 5.11 Factors for Calculating Three-Sigma Limits for the Chart and R-Chart Factor for Factors Factors Size of UCL and for LCL for UCL LCL for x- for for Sample (n) bar- R-Charts R-Charts Charts A2 D3 D4 2 1.88 0 3.267 3 1.023 0 2.575 4. 0.729 0 2.282 5 0.577 0 2.115 6 2.004 0.483 0.419 7 1.924 8 0 0.076 0.136 0.184 0.223 0.373 0.337 0.308 1.864 1.816 9 10 1.777 Source: 1950 ASTM Manual on Quality Control of Materials, copyright American Society for Testing Materials. Reprinted with permission. Thermostats are subjected to rigorous testing before they are shipped to air conditioning technicians around the world. Thermostats are subjected to rigorous testing before they are shipped to air conditioning technicians around the world. Results from the last five samples are shown in the table. Calculate control limits for a chart that will monitor performance to target. Observation Sample Sample Sample Sample Sample # 1 2 3 4 5 1 104 100.1 101.1 102 102.7 106.4 104.4 100.4 105.9 105.4 3 101.8 103.6 103 104.6 106.1 4 105.6 101.4 101 102.1 102.5 5 100.6 100.7 104.9 107 102 2. A)What is the Central Line of the control chart()? [ Select ] B) What is the value of the first point plotted on the x-bar chart? [Select] C) What is the upper control limit for the x- bar chart with three sigma limits is: Select) # 1 2 3 4 1 2 3 104 100.1 101.1 102 106.4 104.4 100.4 105.9 101.8 103.6 103 104.6 105.6 101.4 101 102.1 100.6 100.7 104.9 107 4 5 A)What is the Central Line of the control chart()? 102.0 B) What is the value of the first point plotted on the x-bar chart? 103.7 C) What is the upper control limit for the x- bar chart with three sigma limits is: Done [Select ] 102.3 103.7 105.9 103.2

Step by Step Solution

There are 3 Steps involved in it

1 Expert Approved Answer
Step: 1 Unlock blur-text-image
Question Has Been Solved by an Expert!

Get step-by-step solutions from verified subject matter experts

Step: 2 Unlock
Step: 3 Unlock

Students Have Also Explored These Related General Management Questions!