

Question: fAfter sorting the cards on the first page, list the card letters in the appropriate box below. Linear Quadratic Exponential Too Scattered to Determine Best
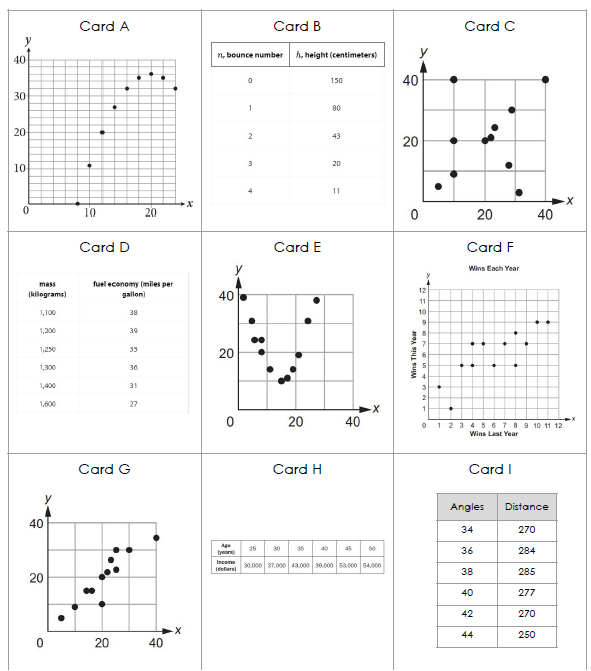

\fAfter sorting the cards on the first page, list the card letters in the appropriate box below. Linear Quadratic Exponential Too Scattered to Determine Best Curve of Fit Now that you have determined the best fit curve for each card, answer the following questions using the cards on the front page. 1. Study card I. Explain how you determined which type of function was the best fit for this set of data. 2. Study card B. This table represents the height of a ball after it has been bounced. During each bounce, the height gets shorter and shorter. The curve of best fit for this card is y = 150 (0.53)*. Use this model to predict the height of the ball after 5 bounces. 3. Study card F. This scatter plot displays the number of wins per round at a tournament. Use an estimated line of best fit to help predict the number of wins this year for a team who won 12 times last year
Step by Step Solution
There are 3 Steps involved in it

Get step-by-step solutions from verified subject matter experts