

Question: fast... L M N H concentration 0.03 concentration 0.06 J TRIAL 3 10 ml 0.090M KI 10 ml DI water 10 mL 1.OM H202 13
fast...
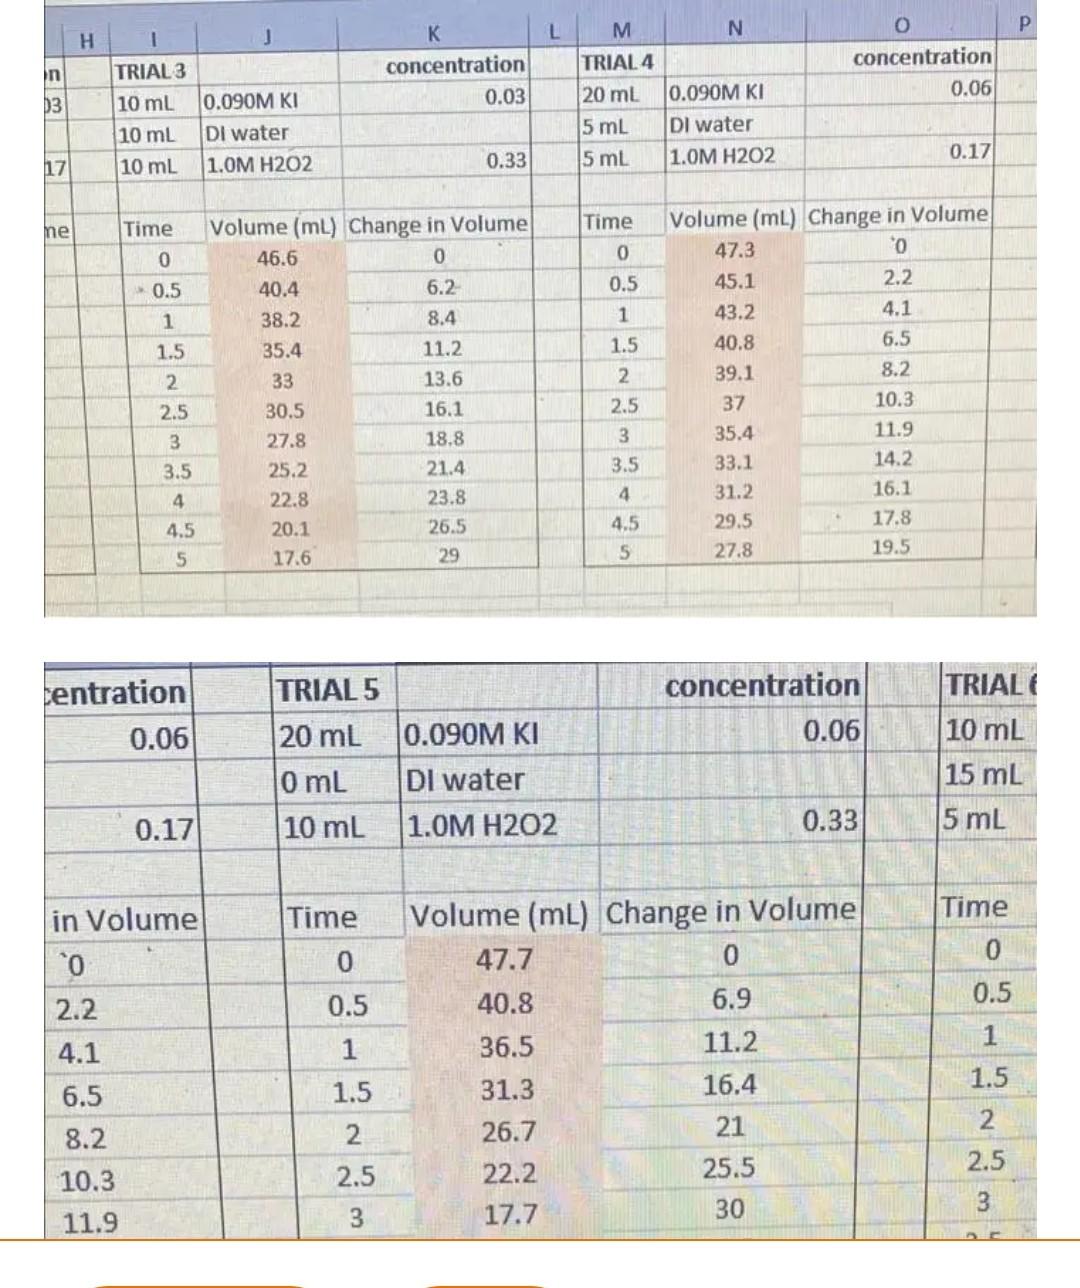
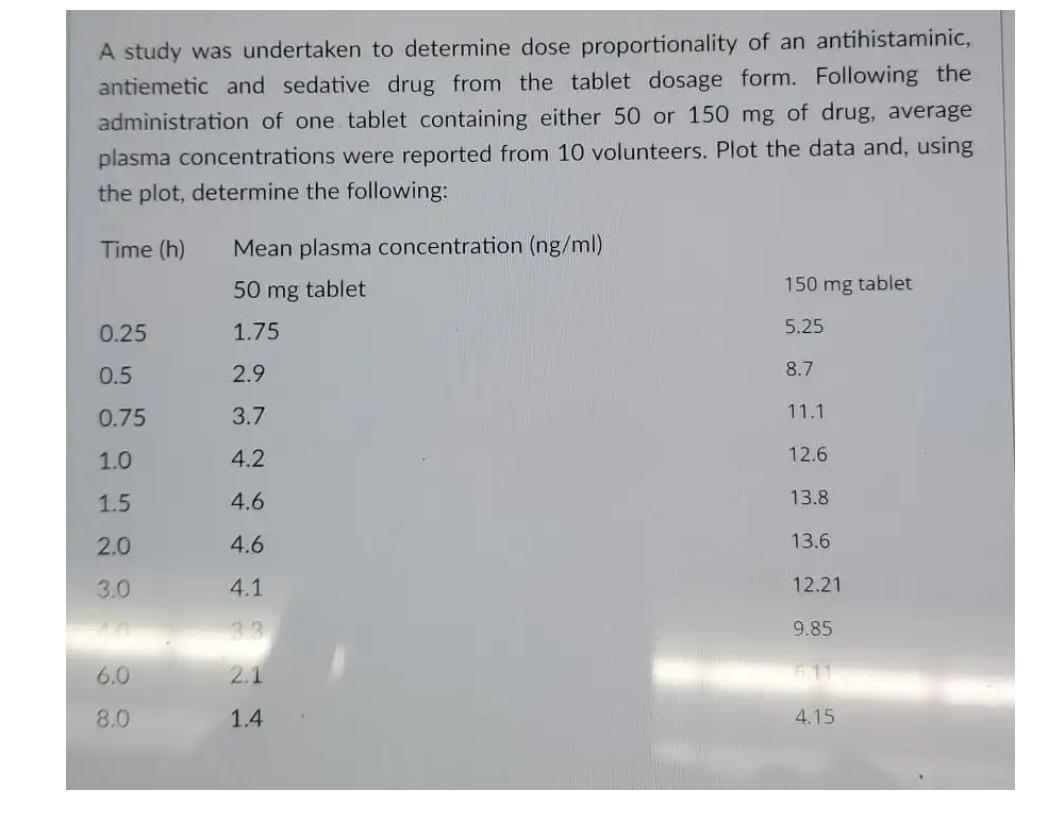
L M N H concentration 0.03 concentration 0.06 J TRIAL 3 10 ml 0.090M KI 10 ml DI water 10 mL 1.OM H202 13 TRIAL 4 20 ml 0.090M KI 5 mL Dl water 5 ml 1.OM H202 0.17 17 0.33 Time ne Time 0 0 0.5 0.5 1 1.5 1 1.5 2 2.5 2 Volume (ml) Change in Volume 46.6 0 40.4 6.2 38.2 8.4 35.4 11.2 33 13.6 30.5 16.1 27.8 18.8 25.2 21.4 22.8 23.8 20.1 26.5 17.6 29 Volume (ml) Change in Volume 47.3 0 45.1 2.2 43.2 4.1 40.8 6.5 39.1 8.2 37 10.3 35.4 11.9 33.1 14.2 31.2 16.1 29.5 17.8 27.8 19.5 2.5 3 3 3.5 3.5 4 4.5 4 4.5 5 5 centration 0.06 concentration 0.06 TRIAL 5 20 ml 0.090M KI 0 mL Dl water 10 mL 1.OM H202 TRIAL 10 mL 15 mL 5 mL 0.17 0.33 Time in Volume 0 0 Time 0 0.5 1 1.5 2.2 4.1 6.5 8.2 10.3 11.9 0.5 1 1.5 Volume (ml) Change in Volume 47.7 0 40.8 6.9 36.5 11.2 31.3 16.4 26.7 21 22.2 25.5 17.7 30 2 2.5 2.5 3 3 A study was undertaken to determine dose proportionality of an antihistaminic, antiemetic and sedative drug from the tablet dosage form. Following the administration of one tablet containing either 50 or 150 mg of drug, average plasma concentrations were reported from 10 volunteers. Plot the data and, using the plot, determine the following: Time (h) Mean plasma concentration (ng/ml) 50 mg tablet 150 mg tablet 0.25 1.75 5.25 0.5 2.9 8.7 0.75 3.7 11.1 1.0 4.2 12.6 1.5 4.6 13.8 2.0 4.6 13.6 3.0 4.1 12.21 9.85 6.0 2.1 1 8.0 1.4 4.15
Step by Step Solution
There are 3 Steps involved in it

Get step-by-step solutions from verified subject matter experts