

Question: FCFF two methods and FCFE three methods There are two worksheet tabs: 1) 'Proforma' tab has proforma data for income and balance sheet. Three color
FCFF two methods and FCFE three methods
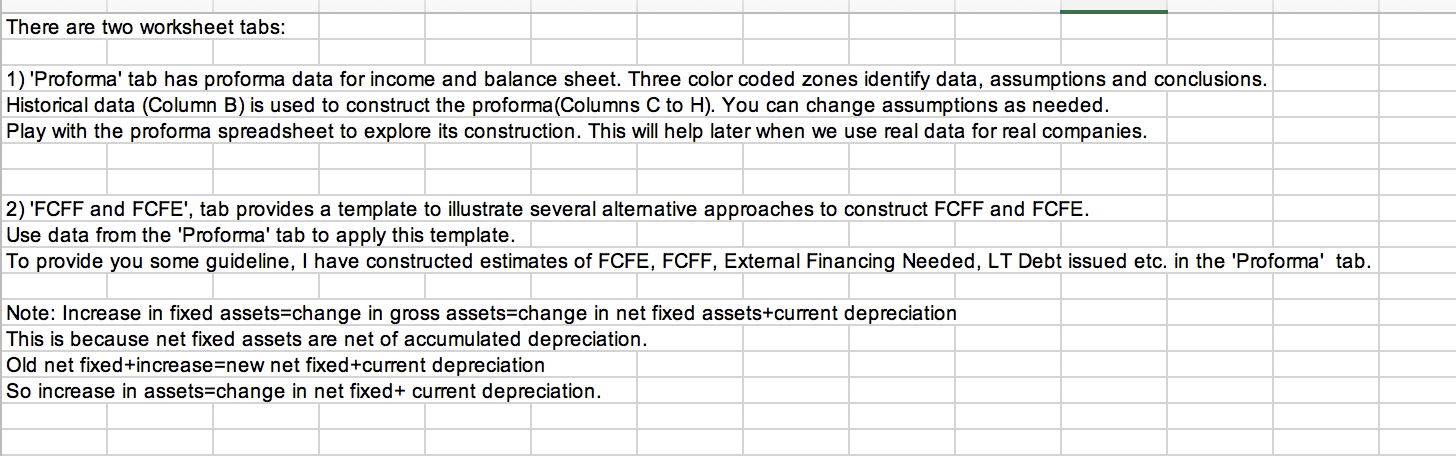
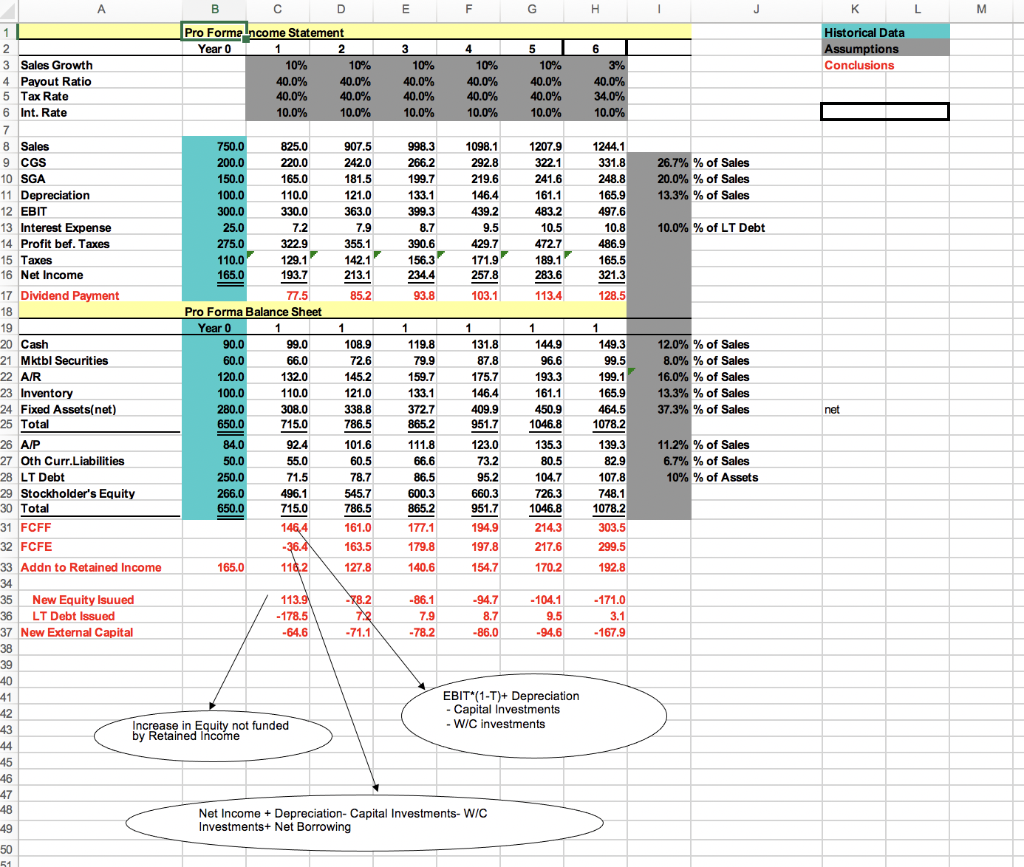
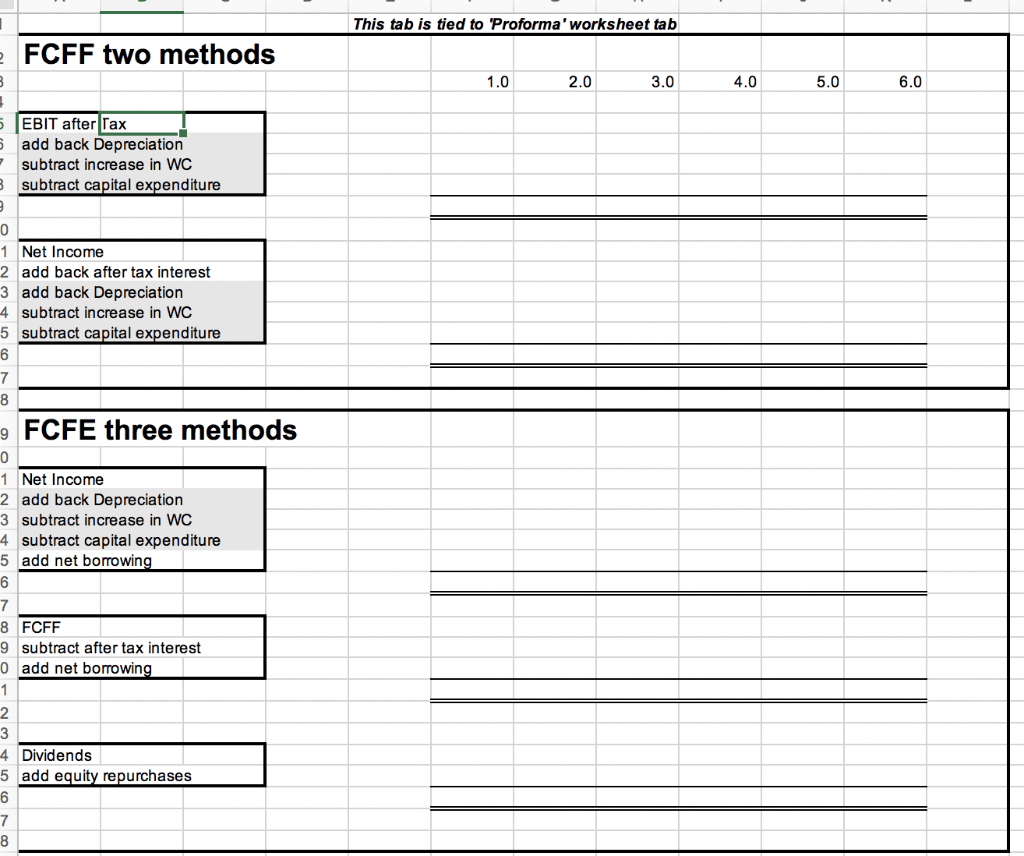
There are two worksheet tabs: 1) 'Proforma' tab has proforma data for income and balance sheet. Three color coded zones identify data, assumptions and conclusions. Historical data (Column B) is used to construct the proforma(Columns C to H). You can change assumptions as needed. Play with the proforma spreadsheet to explore its construction. This will help later when we use real data for real companies. 2) 'FCFF and FCFE', tab provides a template to illustrate several alternative approaches to construct FCFF and FCFE. Use data from the 'Proforma' tab to apply this template. To provide you some guideline, I have constructed estimates of FCFE, FCFF, External Financing Needed, LT Debt issued etc. in the 'Proforma' tab. Note: Increase in fixed assets=change in gross assets=change in net fixed assets+current depreciation This is because net fixed assets are net of accumulated depreciation. Old net fixed+increase=new net fixed+current depreciation So increase in assets=change in net fixed+ current depreciation. H 1 J L M Historical Data Assumptions Conclusions 40.0% 6 3% 40.0% 34.0% 10.0% 40.0% 10.0% 26.7% % of Sales 20.0% % of Sales 13.3% % of Sales 1244.1 331.8 248.8 165.9 497.6 10.8 486.9 165.5 321.3 10.0% % of LT Debt 128.5 Year 0 1 20 Cash 12.0% % of Sales 8.0% % of Sales 16.0% % of Sales 13.3% % of Sales 37.3% % of Sales net B D E F G 1 Pro Forma Income Statement 2 Year 0 1 2 3 5 3 Sales Growth 10% 10% 10% 10% 10% 4 Payout Ratio 40.0% 40.0% 40.0% 40.0% 5 Tax Rate 40.0% 40.0% 40.0% 40.0% 6 Int. Rate 10.0% 10.0% 10.0% 10.0% 7 8 Sales 750.0 825.0 907.5 998.3 1098.1 1207.9 aces 9 CGS 200.0 220.0 242.0 266.2 292.8 322.1 10 SGA 150.0 165.0 181.5 199.7 219.6 241.6 4000 4400 11 Depreciation 100.0 110.0 121.0 133.1 146.4 161.1 40 FOI 12 EBIT 300.0 330.0 363.0 399.3 439.2 483.2 13 Interest Expense 25.0 7.2 7.9 8.7 9.5 10.5 14 Profit bef. Taxes 275.0 322.9 355.1 390.6 429.7 472.7 15 Taxes 110.0 129.1 142.1 156.3 171.9 189.1 16 Net Income 165.0 193.7 213.1 234.4 257.8 283.6 17 Dividend Payment 77.5 85.2 93.8 103.1 113.4 18 Pro Forma Balance Sheet 19 1 1 1 1 1 1 90.0 99.0 108.9 119.8 131.8 144.9 21 Mktbl Securities 60.0 66.0 72.6 79.9 87.8 96.6 22 AIR 120.0 132.0 145.2 159.7 175.7 193.3 23 Inventory 100.0 110.0 121.0 133.1 146.4 161.1 24 Fixed Assets(net) 280.0 308.0 338.8 372.7 409.9 450.9 25 Total 650.0 715.0 786.5 865.2 951.7 1046.8 26 A/P 84.0 92.4 101.6 111.8 123.0 135.3 27 Oth Curr.Liabilities 50.0 55.0 60.5 66.6 73.2 80.5 28 LT Debt 250.0 71.5 78.7 86.5 95.2 104.7 29 Stockholder's Equity 266.0 496.1 545.7 600.3 660.3 726.3 30 Total 650.0 715.0 786.5 865.2 951.7 1046.8 31 FCFF 146,4 161.0 177.1 194.9 214.3 32 FCFE -36.4 163.5 179.8 197.8 217.6 33 Addn to Retained Income 165.0 116.2 127.8 140.6 154.7 170.2 34 35 New Equity Isuued 113.9 - 8.2 -86.1 -94.7 - 104.1 36 LT Debt Issued -178.5 7.9 8.7 9.5 37 New External Capital -64.6 -71.1 -78.2 -86.0 -94.6 38 39 40 41 EBIT"(1-T)+ Depreciation 42 - Capital Investments 10 43 Increase in Equity not funded -W/C investments by Retained Income 44 45 -46 +0 47 48 Net Income + Depreciation- Capital Investments-W/C 49 Investments+ Net Borrowing 50 51 149.3 99.5 199.1 165.9 464.5 1078.2 139.3 82.9 107.8 748.1 1078.2 11.2% % of Sales 6.7% % of Sales 10% % of Assets 303.5 299.5 192.8 -171.0 3.1 -167.9 This tab is tied to 'Proforma' worksheet tab - FCFF two methods 1.0 2.0 3.0 4.0 5.0 6.0 5 EBIT after Tax add back Depreciation subtract increase in WC subtract capital expenditure 9 0 1 Net Income 2 add back after tax interest 3 add back Depreciation 4 subtract increase in WC 5 subtract capital expenditure 6 7 8 9 FCFE three methods 0 1 Net Income 2 add back Depreciation 3 subtract increase in WC 4 subtract capital expenditure 5 add net borrowing 6 7 8 FCFF 9 subtract after tax interest o add net borrowing 1 2 3 4 Dividends 5 add equity repurchases 6 7 8 There are two worksheet tabs: 1) 'Proforma' tab has proforma data for income and balance sheet. Three color coded zones identify data, assumptions and conclusions. Historical data (Column B) is used to construct the proforma(Columns C to H). You can change assumptions as needed. Play with the proforma spreadsheet to explore its construction. This will help later when we use real data for real companies. 2) 'FCFF and FCFE', tab provides a template to illustrate several alternative approaches to construct FCFF and FCFE. Use data from the 'Proforma' tab to apply this template. To provide you some guideline, I have constructed estimates of FCFE, FCFF, External Financing Needed, LT Debt issued etc. in the 'Proforma' tab. Note: Increase in fixed assets=change in gross assets=change in net fixed assets+current depreciation This is because net fixed assets are net of accumulated depreciation. Old net fixed+increase=new net fixed+current depreciation So increase in assets=change in net fixed+ current depreciation. H 1 J L M Historical Data Assumptions Conclusions 40.0% 6 3% 40.0% 34.0% 10.0% 40.0% 10.0% 26.7% % of Sales 20.0% % of Sales 13.3% % of Sales 1244.1 331.8 248.8 165.9 497.6 10.8 486.9 165.5 321.3 10.0% % of LT Debt 128.5 Year 0 1 20 Cash 12.0% % of Sales 8.0% % of Sales 16.0% % of Sales 13.3% % of Sales 37.3% % of Sales net B D E F G 1 Pro Forma Income Statement 2 Year 0 1 2 3 5 3 Sales Growth 10% 10% 10% 10% 10% 4 Payout Ratio 40.0% 40.0% 40.0% 40.0% 5 Tax Rate 40.0% 40.0% 40.0% 40.0% 6 Int. Rate 10.0% 10.0% 10.0% 10.0% 7 8 Sales 750.0 825.0 907.5 998.3 1098.1 1207.9 aces 9 CGS 200.0 220.0 242.0 266.2 292.8 322.1 10 SGA 150.0 165.0 181.5 199.7 219.6 241.6 4000 4400 11 Depreciation 100.0 110.0 121.0 133.1 146.4 161.1 40 FOI 12 EBIT 300.0 330.0 363.0 399.3 439.2 483.2 13 Interest Expense 25.0 7.2 7.9 8.7 9.5 10.5 14 Profit bef. Taxes 275.0 322.9 355.1 390.6 429.7 472.7 15 Taxes 110.0 129.1 142.1 156.3 171.9 189.1 16 Net Income 165.0 193.7 213.1 234.4 257.8 283.6 17 Dividend Payment 77.5 85.2 93.8 103.1 113.4 18 Pro Forma Balance Sheet 19 1 1 1 1 1 1 90.0 99.0 108.9 119.8 131.8 144.9 21 Mktbl Securities 60.0 66.0 72.6 79.9 87.8 96.6 22 AIR 120.0 132.0 145.2 159.7 175.7 193.3 23 Inventory 100.0 110.0 121.0 133.1 146.4 161.1 24 Fixed Assets(net) 280.0 308.0 338.8 372.7 409.9 450.9 25 Total 650.0 715.0 786.5 865.2 951.7 1046.8 26 A/P 84.0 92.4 101.6 111.8 123.0 135.3 27 Oth Curr.Liabilities 50.0 55.0 60.5 66.6 73.2 80.5 28 LT Debt 250.0 71.5 78.7 86.5 95.2 104.7 29 Stockholder's Equity 266.0 496.1 545.7 600.3 660.3 726.3 30 Total 650.0 715.0 786.5 865.2 951.7 1046.8 31 FCFF 146,4 161.0 177.1 194.9 214.3 32 FCFE -36.4 163.5 179.8 197.8 217.6 33 Addn to Retained Income 165.0 116.2 127.8 140.6 154.7 170.2 34 35 New Equity Isuued 113.9 - 8.2 -86.1 -94.7 - 104.1 36 LT Debt Issued -178.5 7.9 8.7 9.5 37 New External Capital -64.6 -71.1 -78.2 -86.0 -94.6 38 39 40 41 EBIT"(1-T)+ Depreciation 42 - Capital Investments 10 43 Increase in Equity not funded -W/C investments by Retained Income 44 45 -46 +0 47 48 Net Income + Depreciation- Capital Investments-W/C 49 Investments+ Net Borrowing 50 51 149.3 99.5 199.1 165.9 464.5 1078.2 139.3 82.9 107.8 748.1 1078.2 11.2% % of Sales 6.7% % of Sales 10% % of Assets 303.5 299.5 192.8 -171.0 3.1 -167.9 This tab is tied to 'Proforma' worksheet tab - FCFF two methods 1.0 2.0 3.0 4.0 5.0 6.0 5 EBIT after Tax add back Depreciation subtract increase in WC subtract capital expenditure 9 0 1 Net Income 2 add back after tax interest 3 add back Depreciation 4 subtract increase in WC 5 subtract capital expenditure 6 7 8 9 FCFE three methods 0 1 Net Income 2 add back Depreciation 3 subtract increase in WC 4 subtract capital expenditure 5 add net borrowing 6 7 8 FCFF 9 subtract after tax interest o add net borrowing 1 2 3 4 Dividends 5 add equity repurchases 6 7 8
Step by Step Solution
There are 3 Steps involved in it

Get step-by-step solutions from verified subject matter experts