

Question: fComplete parts (a) through (h) for the data below. 20 30 40 50 y 75 70 62 50 (a) By hand, draw a scatter diagram
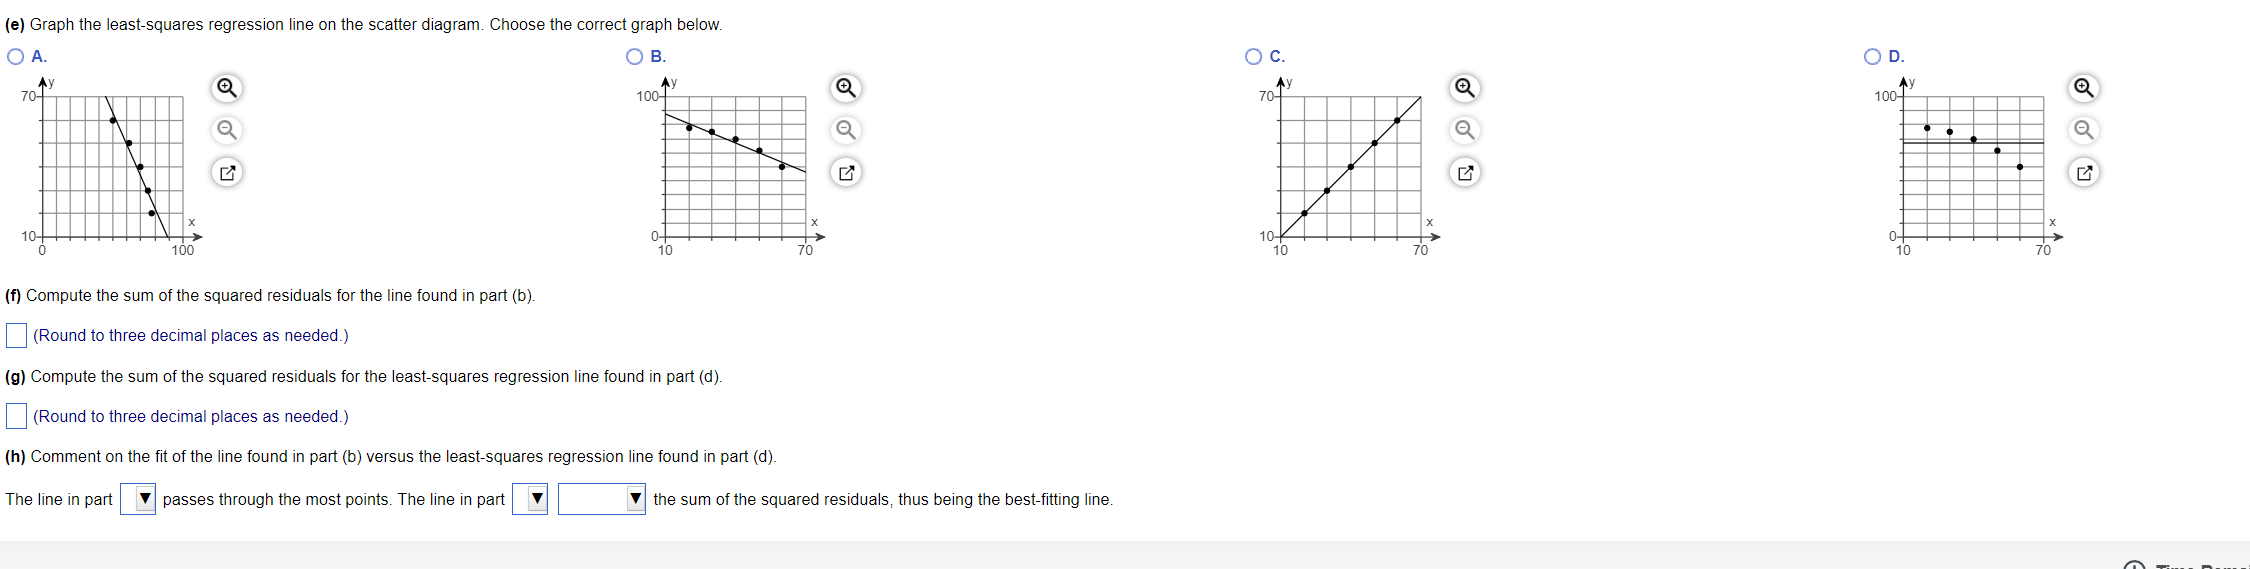
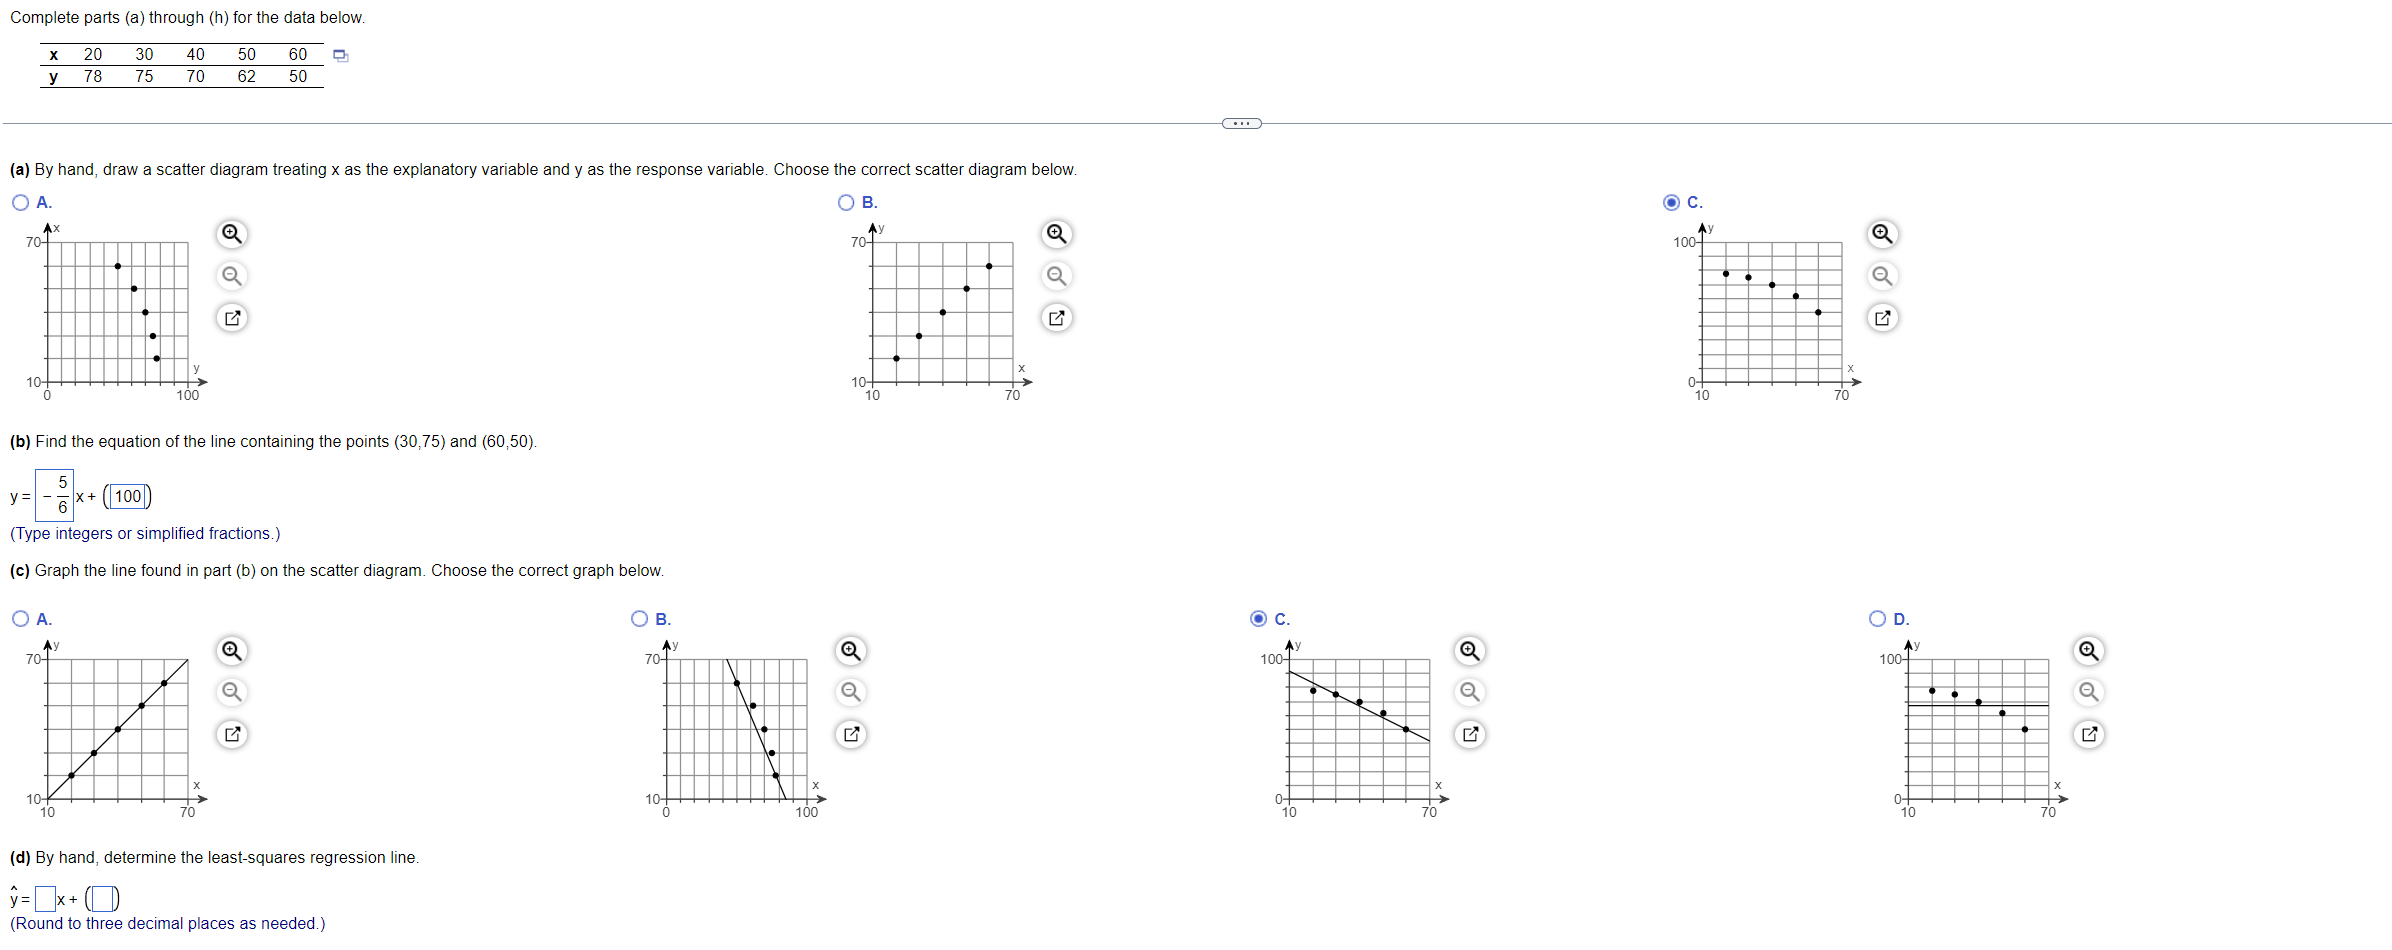


\fComplete parts (a) through (h) for the data below. 20 30 40 50 y 75 70 62 50 (a) By hand, draw a scatter diagram treating x as the explanatory variable and y as the response variable. Choose the correct scatter diagram below. A. O B. O C. 70 AX Q 100 1 10+ 70 of 70 (b) Find the equation of the line containing the points (30,75) and (60,50). y= - 6 X+ (100) Type integers or simplified fractions.) (c) Graph the line found in part (b) on the scatter diagram. Choose the correct graph below. O A. OB O C. OD. 70- 70- 100- 100- 10 100 10 70 70 (d) By hand, determine the least-squares regression line. y=[x + (0) (Round to three decimal places as needed.)
Step by Step Solution
There are 3 Steps involved in it

Get step-by-step solutions from verified subject matter experts