

Question: fContour plot for point and line configuration Series4 Series3 Series2 Series1 2 3 4 5 6 7 8 9 10 [0.2-0.3 0.3-0.4 00.4-0.5 00.5-0.6

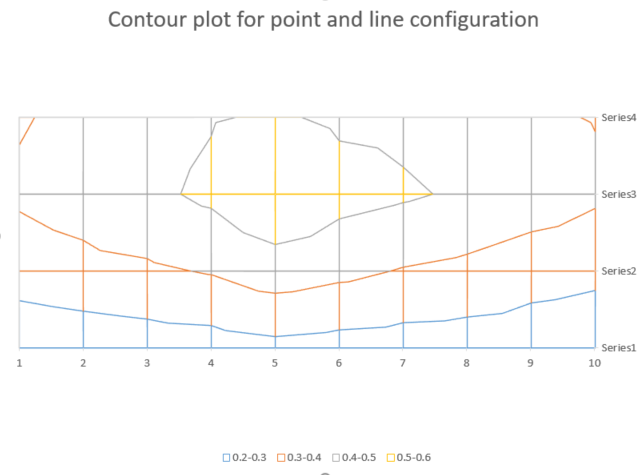

\fContour plot for point and line configuration Series4 Series3 Series2 Series1 2 3 4 5 6 7 8 9 10 [0.2-0.3 0.3-0.4 00.4-0.5 00.5-0.6
Step by Step Solution
There are 3 Steps involved in it
1 Expert Approved Answer
Step: 1 Unlock

Question Has Been Solved by an Expert!
Get step-by-step solutions from verified subject matter experts
Step: 2 Unlock
Step: 3 Unlock