

Question: Feel free to construct your Gantt charts in a program like Excel but copy and paste your work into Word so that they are legible
Feel free to construct your Gantt charts in a program like Excel but copy and paste your work into Word so that they are legible in Word.
For the project tracking Gantt charts, use the formats shown in my PowerPoint presentation titled 'Performance Monitoring and Control'.
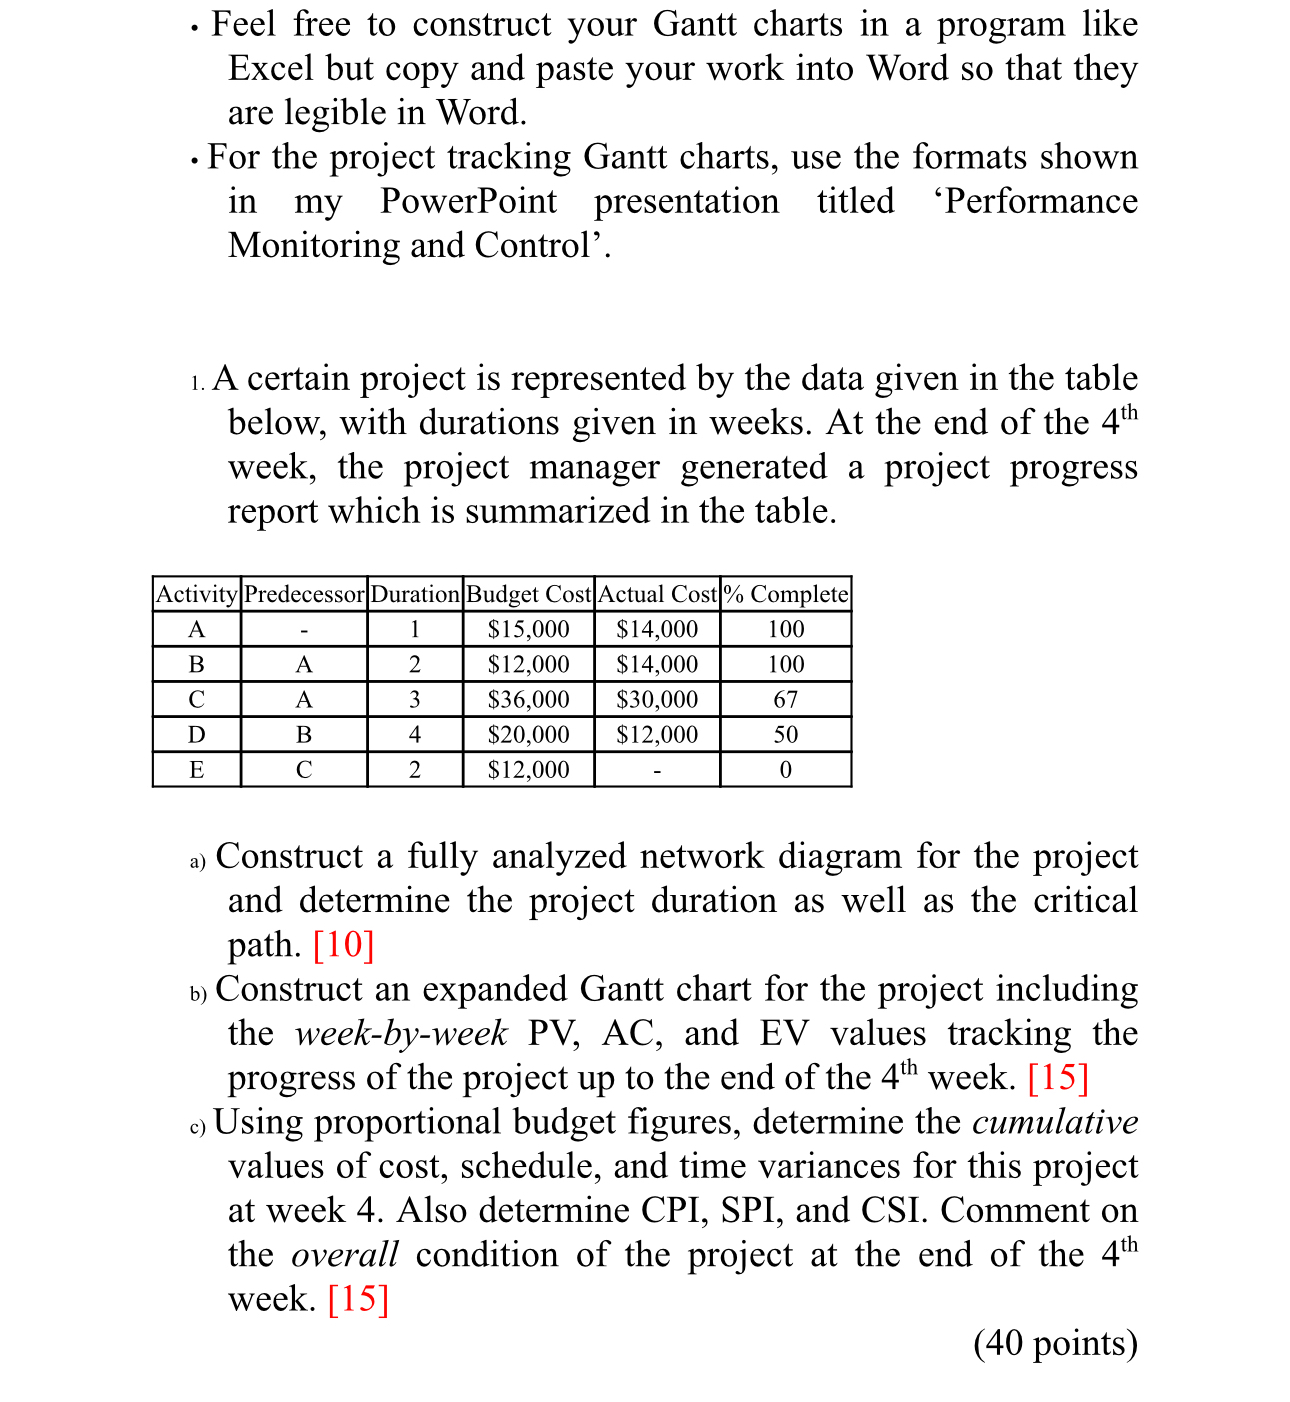
A certain project is represented by the data given in the table below, with durations given in weeks. At the end of the week, the project manager generated a project progress report which is summarized in the table.
tableActivityPredecessor,Duration,Budget Cost,Actual Cost, CompleteA$$BA$$CA$$DB$$EC$
a Construct a fully analyzed network diagram for the project and determine the project duration as well as the critical path.
b Construct an expanded Gantt chart for the project including the weekbyweek PV AC and EV values tracking the progress of the project up to the end of the week.
c Using proportional budget figures, determine the cumulative values of cost schedule, and time variances for this project at week Also determine CPI, SPI, and CSI. Comment on the overall condition of the project at the end of the week.
points
Step by Step Solution
There are 3 Steps involved in it
1 Expert Approved Answer
Step: 1 Unlock

Question Has Been Solved by an Expert!
Get step-by-step solutions from verified subject matter experts
Step: 2 Unlock
Step: 3 Unlock