

Question: Fefer to Table Sb.1 - Factern for Comsuting Pontol Chart Lmits i3 aigna) tor this problem A process that is consibered to be in control
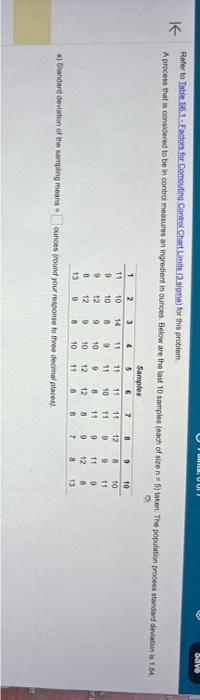
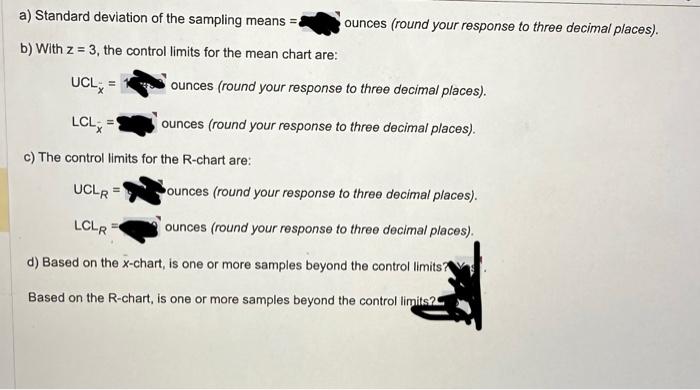
Fefer to Table Sb.1 - Factern for Comsuting Pontol Chart Lmits i3 aigna) tor this problem A process that is consibered to be in control measures an ingredient in ounces. Below are the last to sprples (each of size n=5 ) taken. The populabion procest stardard deriatoh in 1.64 . a) Siandard deviasion of the sampling means = Cunces irotind your responte to thee deoknal plscess. a) Standard deviation of the sampling means = ounces (round your response to three decimal places). b) With z=3, the control limits for the mean chart are: UCL=LCL=ounces(roundyourresponsetothreedecimalplaces). c) The control limits for the R-chart are: UCLR=ounces(roundyourresponsetothreedecimalplaces).LCLR d) Based on the x-chart, is one or more samples beyond the control limits? Based on the R-chart, is one or more samples beyond the control limits? Fefer to Table Sb.1 - Factern for Comsuting Pontol Chart Lmits i3 aigna) tor this problem A process that is consibered to be in control measures an ingredient in ounces. Below are the last to sprples (each of size n=5 ) taken. The populabion procest stardard deriatoh in 1.64 . a) Siandard deviasion of the sampling means = Cunces irotind your responte to thee deoknal plscess. a) Standard deviation of the sampling means = ounces (round your response to three decimal places). b) With z=3, the control limits for the mean chart are: UCL=LCL=ounces(roundyourresponsetothreedecimalplaces). c) The control limits for the R-chart are: UCLR=ounces(roundyourresponsetothreedecimalplaces).LCLR d) Based on the x-chart, is one or more samples beyond the control limits? Based on the R-chart, is one or more samples beyond the control limits
Step by Step Solution
There are 3 Steps involved in it

Get step-by-step solutions from verified subject matter experts