

Question: Below are four bivariate data sets and their scatter plots. (Note that all of the scatter plots are displayed with the same scale.) Each
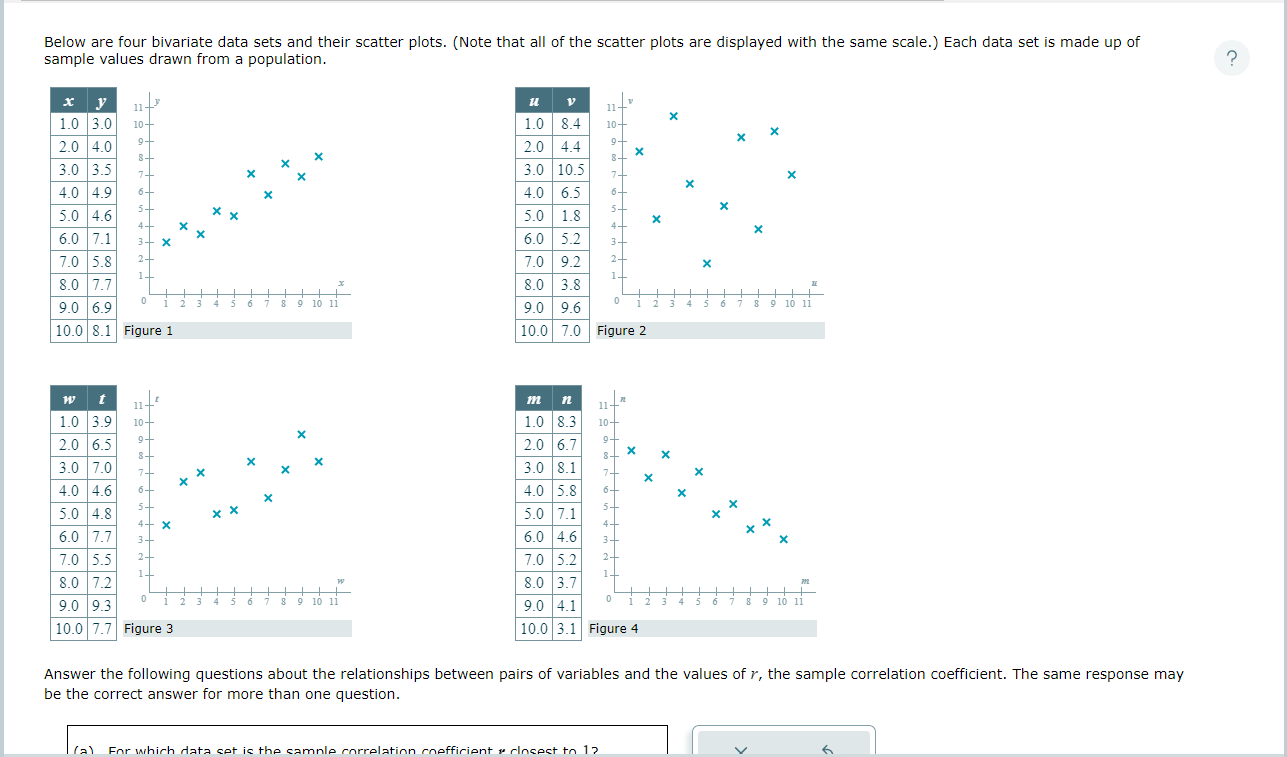


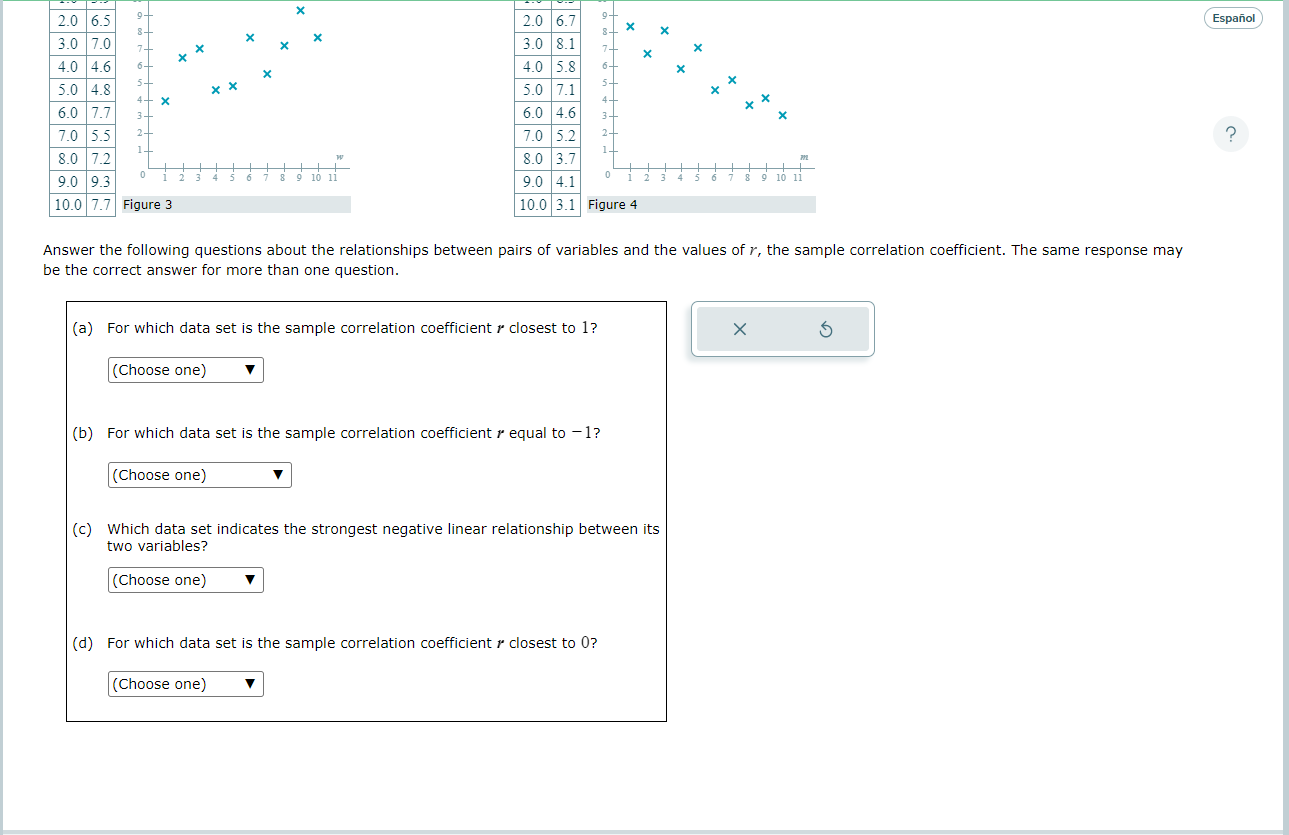
Below are four bivariate data sets and their scatter plots. (Note that all of the scatter plots are displayed with the same scale.) Each data set is made up of sample values drawn from a population. 10 11 10 11 1.0 3.0 4.0 6.0 7.0 9.0 10.0 1.0 2.0 3.0 4.0 6.0 7.0 8.0 9.0 10.0 3.0 4.0 35 4.9 4.6 7.1 7.7 6.9 8.1 3.9 65 7.0 4.6 4.8 7.7 7.2 9.3 7.7 Figure 1 Figure 3 1.0 3.0 4.0 6.0 7.0 8.0 9.0 10.0 1.0 2.0 3.0 4.0 6.0 7.0 8.0 9.0 10.0 8.4 4.4 65 1.8 9.2 3.8 9.6 7.0 8.3 6.7 8.1 7.1 4.6 3.7 Figure 2 X X x g 10 11 g 10 11 3.1 Figure 4 Answer the following questions about the relationships between be the correct answer for more than one question. pairs of variables and the values of r, the sample correlation coefficient. The same response may
Step by Step Solution
There are 3 Steps involved in it

Get step-by-step solutions from verified subject matter experts