

Question: Graphical Analysis [n Exercises 23 and 24, use the relative frequency histogram to (a) identify rhe class with rhe greatest, and rhe class with

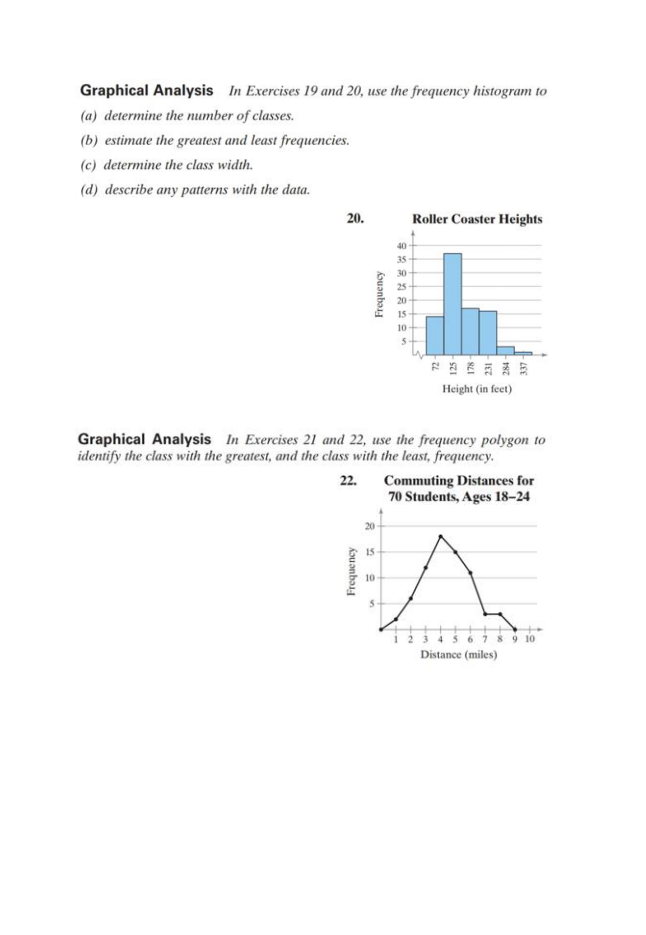
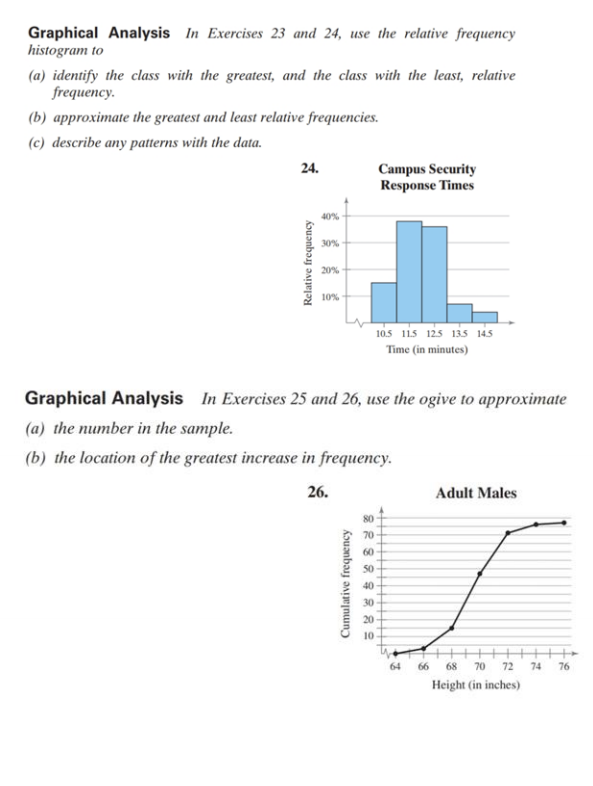

Graphical Analysis [n Exercises 23 and 24, use the relative frequency histogram to (a) identify rhe class with rhe greatest, and rhe class with the least, relative frequency. (b) approximate the greatest and least relative frequencies. (c) describe any patterns with (he data. Campus Security Response limes ILS 123 14_S (in minutes) Graphical Analysis In Exercises 25 and 26, use the ogive to approximate (a) the number in the sample. (b) the location of the greatest increase in frequency. 64 Adult Males 7072 Height (in iwhes) 76
Step by Step Solution
There are 3 Steps involved in it
1 Expert Approved Answer
Step: 1 Unlock

Question Has Been Solved by an Expert!
Get step-by-step solutions from verified subject matter experts
Step: 2 Unlock
Step: 3 Unlock