

Question: Graphical Analysis In Exercises I 9 and 26', use the frequency histogram ta ( a } determine the number of classes. (b) estimate the 'equency

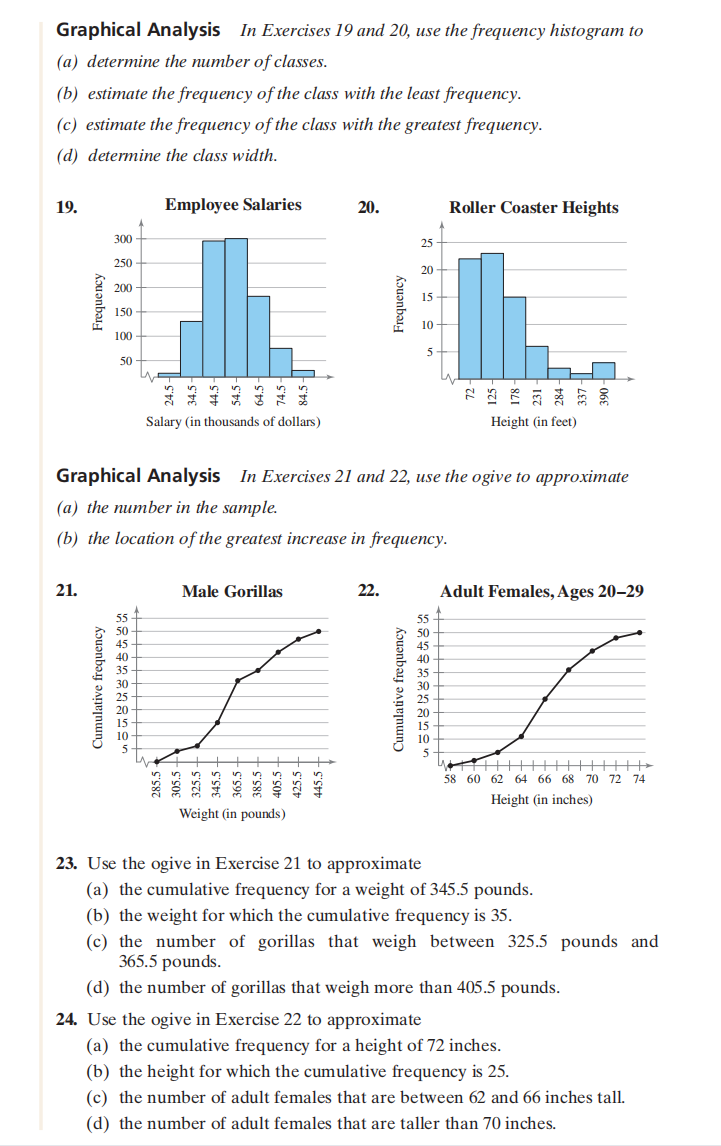
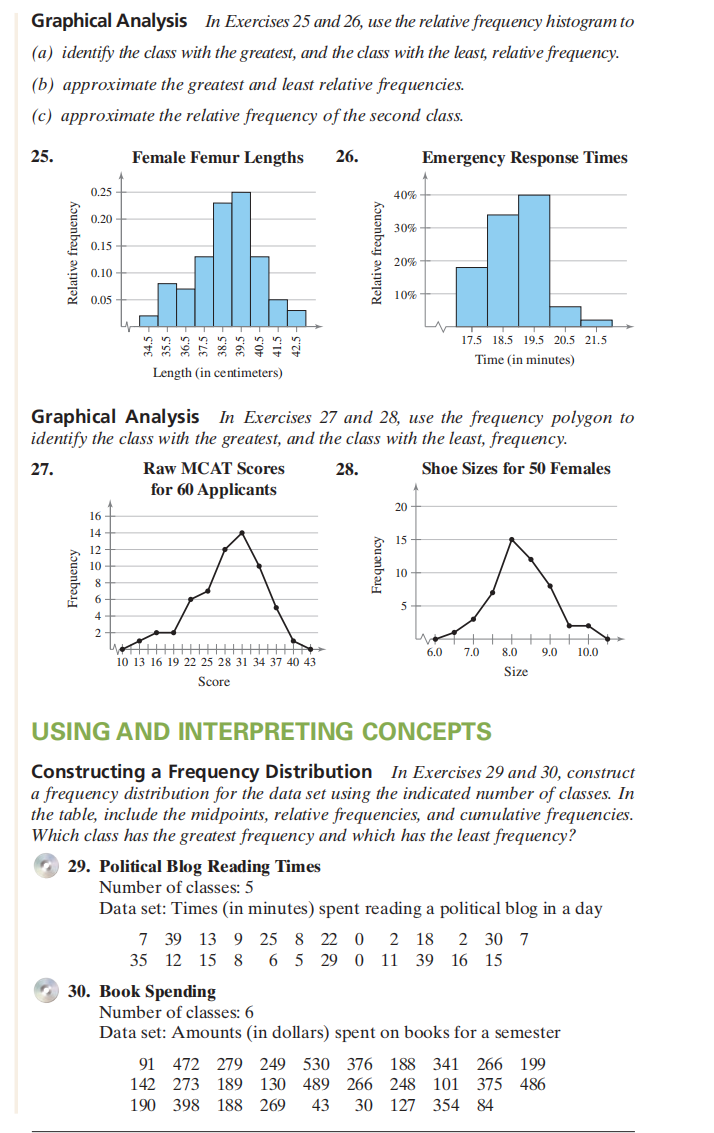
Graphical Analysis In Exercises I 9 and 26', use the frequency histogram ta ( a } determine the number of classes. (b) estimate the 'equency of the class with the feast 'equency. (c) estimate the frequency of the ctass with the greatest 'equency. (it) determine the class width. 19'. '5 :31 3' a 3 FL 3' 531m (at thousands Ofdnm's] Height {in tea] Graphical Analysis In Exercises 2.! and 22, use the agive to approximate (a) the number in the sampt'e. (b) the iacatian of the greatest increase in requency. 2]. Male Gorilla 22. Adult Females, Ages 2329 % 55 50 45 E Cumulative eqmey Ln 5 G E E: s s Cumulative frequmcy u. 5 E 8 E3: 3 3 t?- B a M!" 536062646668TOT2T4 "inghting: mssss Hdgmmm] Weight (in pomlrls] 23. Use the ogive in Exercise 21 to approximate (a) the cumulative frequency for a weight of 345.5 pounds. (b) the weight for which the cumulative frequency is 35. (c) the number of gorillas that weigh between 325.5 pounds and 365.5 pounds. (d) the number of gorillas that weigh more than 405.5 pounds. 24. Use the ogive in Exercise 22 to approximate (a) the cumulative frequency for a height of 1'2 inches. (b) the height for which the cumulative frequency is 25. (c) the number of adult females that are between 62 and 66 inches tall. (d) the number of adult females that are taller than TI] inches. Graphical Analysis in Exercises25 and 26, use the relative frequency histogram to {a} identt' the ciass with the greatest, and the ciass with the least, reiatiue frequency. {b} approximate the greatest and ieast relative frequencies. {c} approximate the reiative frequency o f the second ciass. 25. Female Femur Lengths 26- Emergmcy Response Times E 40% E EEE Relative frequency D E E Relative frequency [75 [35 [95 2115 2L5 T'nnenminutes] Graphical Analysis in Exercises 27 and 23, use the frequency polygon to identify the class with the greatest, and the ciass with the ieast, frequency. 27. Raw MEAT Scores 23. Shoe Sizes for 50 Females for til} Applicants m... ll] [3 l6 l92225233l34374043 Some an "in an 911 um Sine USING AND INTERPRETING CONCEPTS Constructing 3 Frequency Distribution in Exercises 29 and 36', construct a frequency distribution for the data set using the indicated number of ciasses. In the tabie, inciude the midpoints, reiative frequencies, and cumulative frequencies. Which class has the greatest frequency and which has the least frequency? '3: 29. Political Blag Reading Tintes Number of classes: 5 Data set: Times (in minutes} spent reading a political blag in a clay 2391392532211 213 231}? 3512153 65291111391615 '5'? at. Bank Spending Number of classes: 6 Data set: Amounts (in dollars) spent on books for a semester 91 422 229 249 531]I 326 133 341 266 199 142 223 139 131] 439 266 243 1111 375 436 15'] 393 133 269 43 3|] 12'?Ir 354 34
Step by Step Solution
There are 3 Steps involved in it

Get step-by-step solutions from verified subject matter experts