

Question: Click the following icon to view additional information necessary to complete the exencse. Suppose market demand for oil increases to 02, as illustrated in
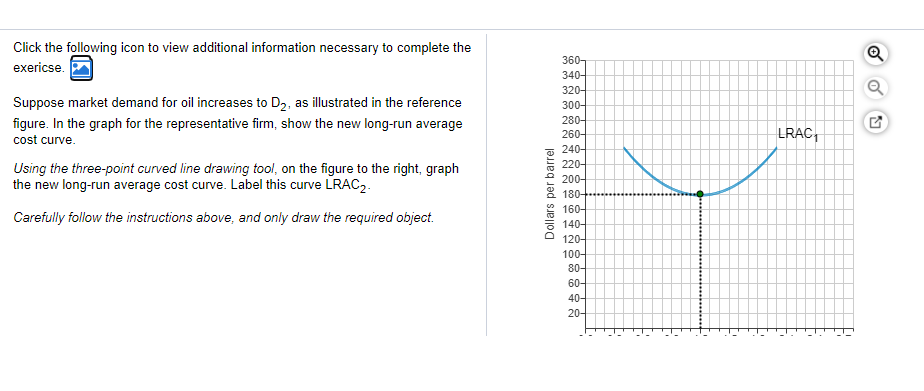
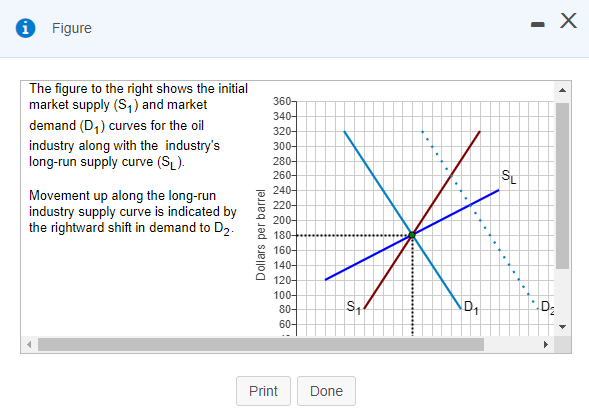
Click the following icon to view additional information necessary to complete the exencse. Suppose market demand for oil increases to 02, as illustrated in the reference figure. In the graph for the representative firm, show the new long-run average cost curve. Using the three-point curved 'ine drawing tool, on the figure to the right, graph the new long-run average cost curve. Label this curve LRAC2 Carefully fo//ow the instructions above, and only draw the required object. 12
Step by Step Solution
There are 3 Steps involved in it
1 Expert Approved Answer
Step: 1 Unlock

Question Has Been Solved by an Expert!
Get step-by-step solutions from verified subject matter experts
Step: 2 Unlock
Step: 3 Unlock