

Question: I have failed to include the chart in the top right corner but am hoping you can help me with this anyway. Click the following
I have failed to include the chart in the top right corner but am hoping you can help me with this anyway.
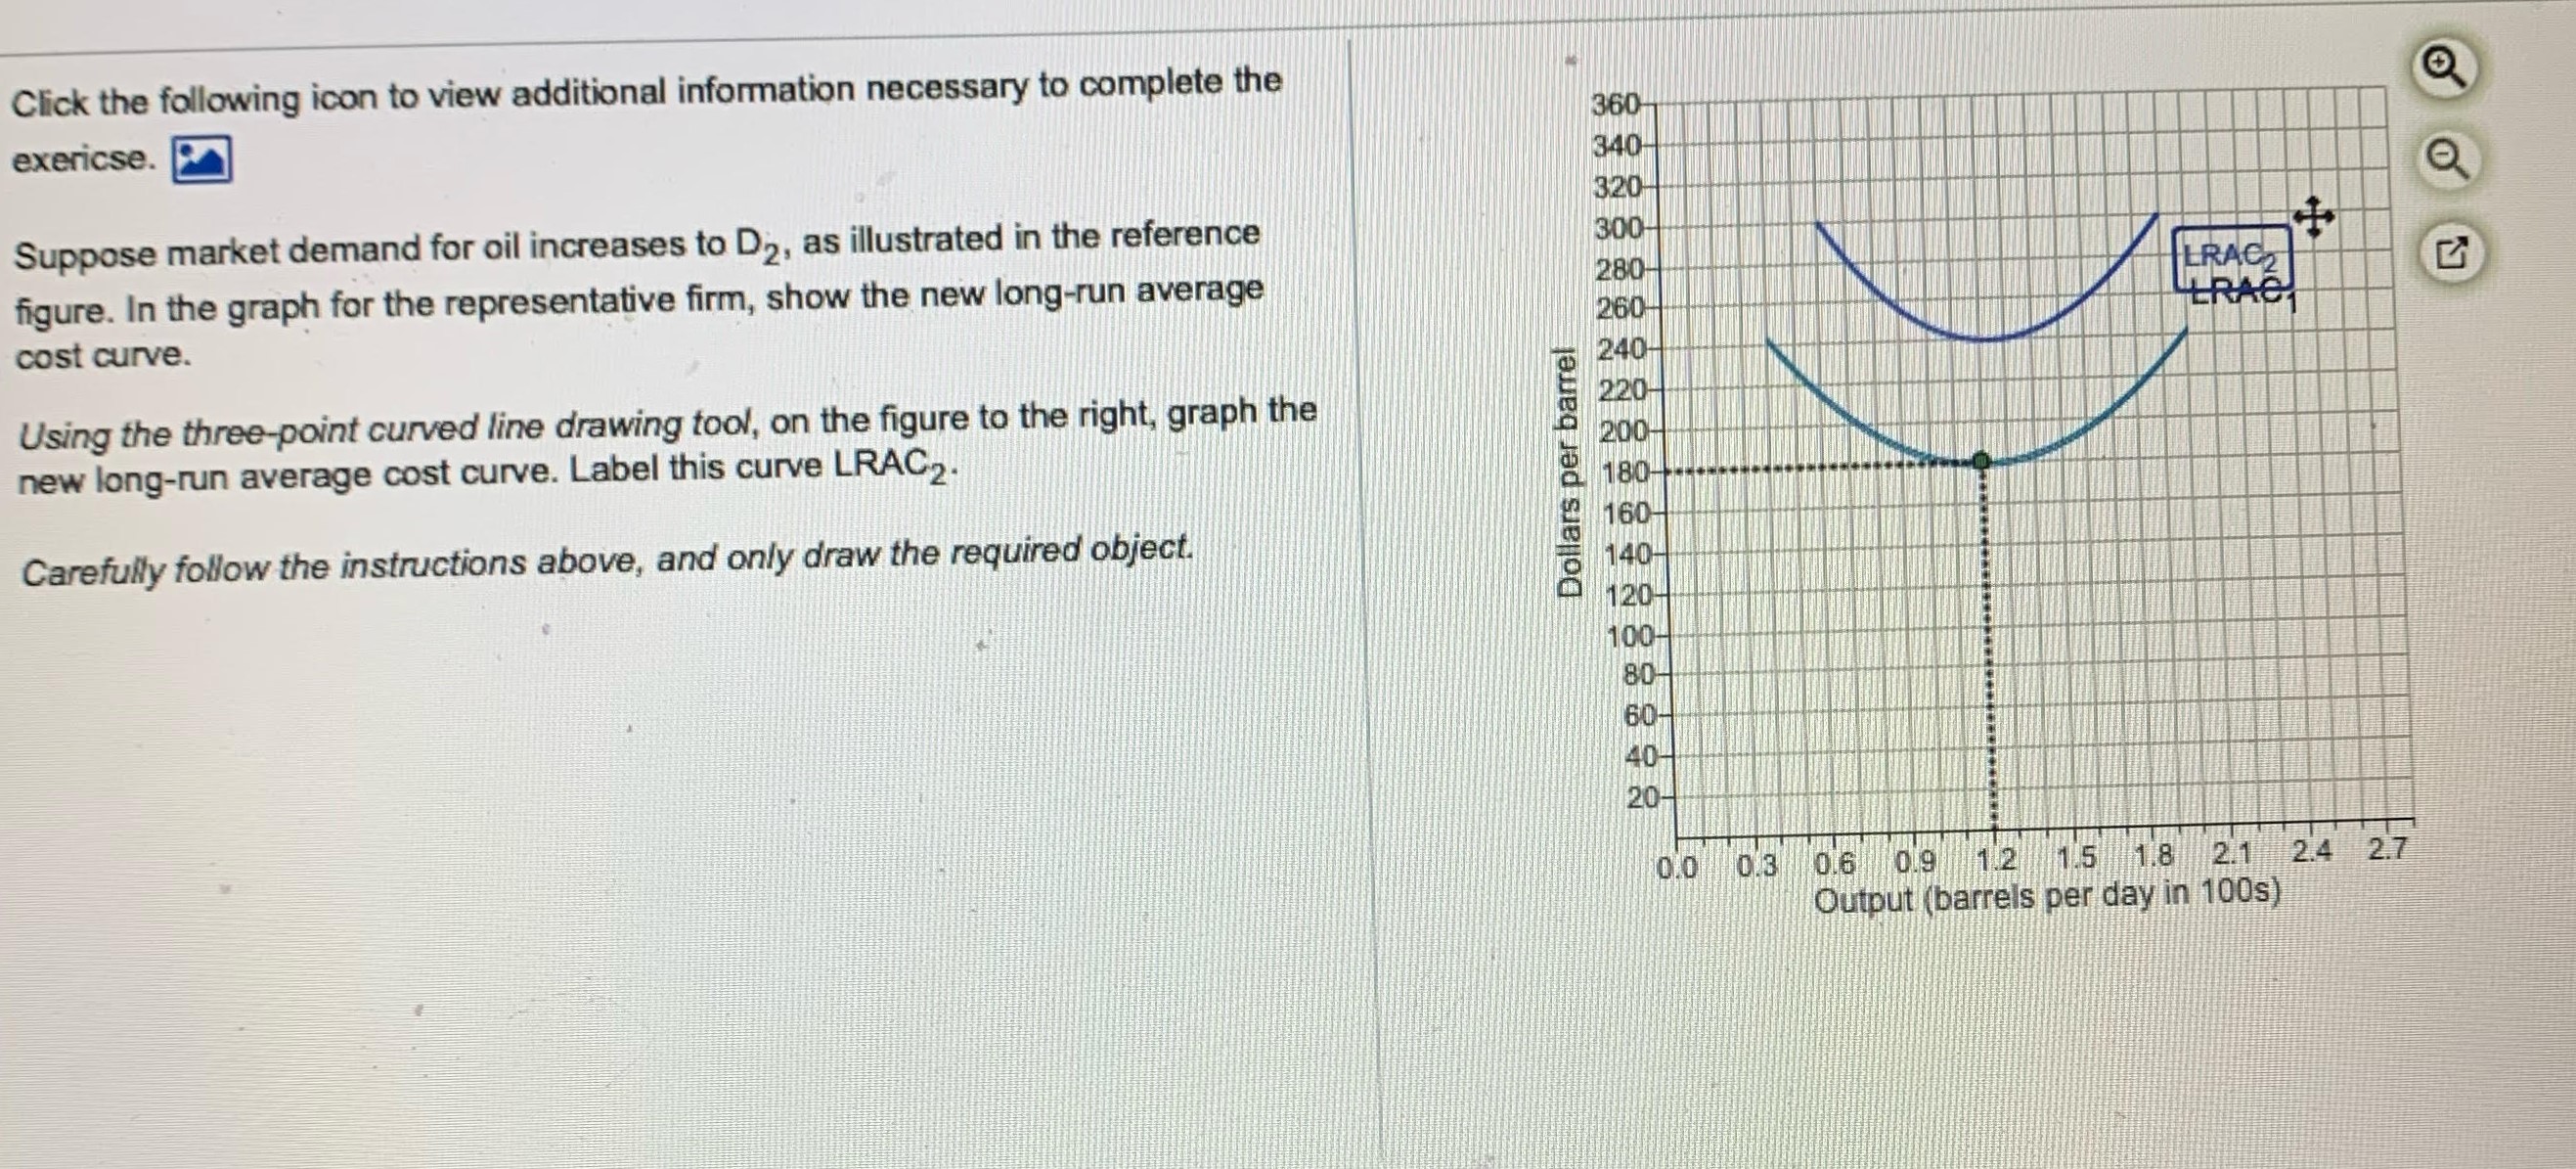
Click the following icon to view additional information necessary to complete the exericse. 360 340 320 O Suppose market demand for oil increases to D2, as illustrated in the reference 300 figure. In the graph for the representative firm, show the new long-run average 280 LRACE cost curve. 260 LRAC Dollars per barrel 240- Using the three-point curved line drawing tool, on the figure to the right, graph the 220- new long-run average cost curve. Label this curve LRAC2. 200- Carefully follow the instructions above, and only draw the required object. 868885838 0.0 0.3 0.6 0 9 12 15 18 21 24 2.7 Output (barrels per day in 100s)
Step by Step Solution
There are 3 Steps involved in it

Get step-by-step solutions from verified subject matter experts