

Question: f3. Data Collection and Analysis [a The conversion factor for your thermopile. (b A table of values for D! h, arr Li 3'! Ar and
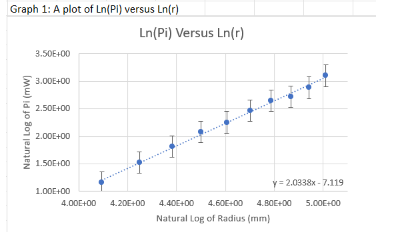
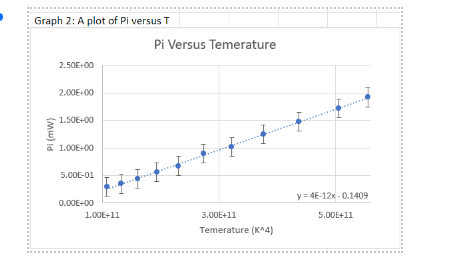
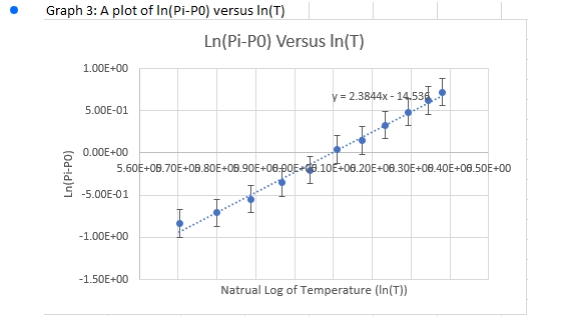
\f3. Data Collection and Analysis [a The conversion factor for your thermopile. (b A table of values for D! h, arr Li 3'! Ar and or Use the cooling jacket aperture diameter (3') to approximate the blackbody aperatrlre area (A), and the funnel entrance diameter (D) to calculate the detector aperture area (a). Include uncertainties in all parameters. [c Calculation of the minimum separation distance between the sorirce and the detector using the measured dimensions and your expression from Prelab lQuestion 5. (d For Procedlne Step F, a table of values for solacedetector separation, r, ]n(-r)_. voltmeter readings, V, incident power, P}! and 111(Pi}. Include uncertainties in all parameters Note the oven temperature. [e A plot of ln(P,-} versrrs lnlfr}+ with error bars (uncertainty bars}. Find the equation of the regression line. (f For Procedure Step 5, a table of values for oven temperature, T1 voltage, V, incident power on the thermopile {using the given conversion factor}, Pg, and temperature to the fourth power, T'. Include uncertainties in all parameters. Note the distance between the detector and the source. [g A plot of P,- versns T4, with error bars [uncertainty bars]. Find the equation of the regression line. (h A table of values for lnT}, lnPl- Pa}! and their uncertainties. (i A plot of lnl[P,- P0} versus lnT}, where P\" is the yintercept from Data Requirement 3g. Find the equation of the regression line. =1. Results and Discussion (a) Determine a value for the Stefan-Boltzmann constant from Equation 1.5 for each of your graphs in Data Requirements 3g and Bi; Calculate mlcertaintyr for both (h) Discuss the plot made for Data Requirement Be. 'What does this graph indicate about the relationship between the distance from the source to the detector and the power incident on the detector? TWhat does this imply about the model we have used for this relationship? (c) Consider the plot made in Data Requirement 3i. What is the signicance of P0? What does it represent and why does it need to be included in the plot? What can be determined from the slope of the plot? \"that can be determined from the intercept of the plot? Finally, by equating Equations 1.1 and 1.4, a model QAo Pi = T4 (1.5) is obtained that, if valid, predicts the relationship between the power output by a blackbody and it's temperature
Step by Step Solution
There are 3 Steps involved in it

Get step-by-step solutions from verified subject matter experts