

Question: fffPreference Cumulative Frequency Percent Valid Percent Percent Valid Weak Preference 2 10.0 10.0 10.0 2 5 25.0 25.0 35.0 3 2 10.0 10.0 45.0 Neutral
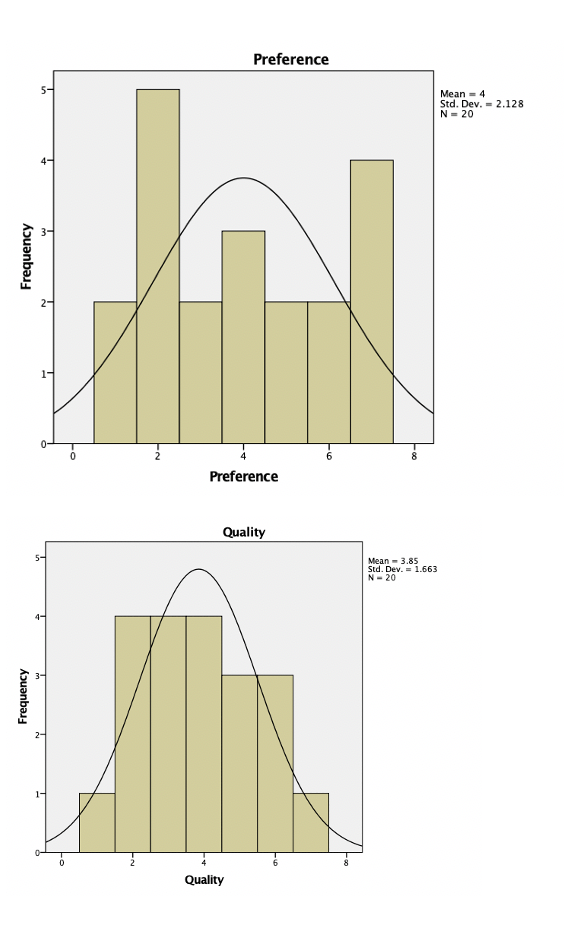
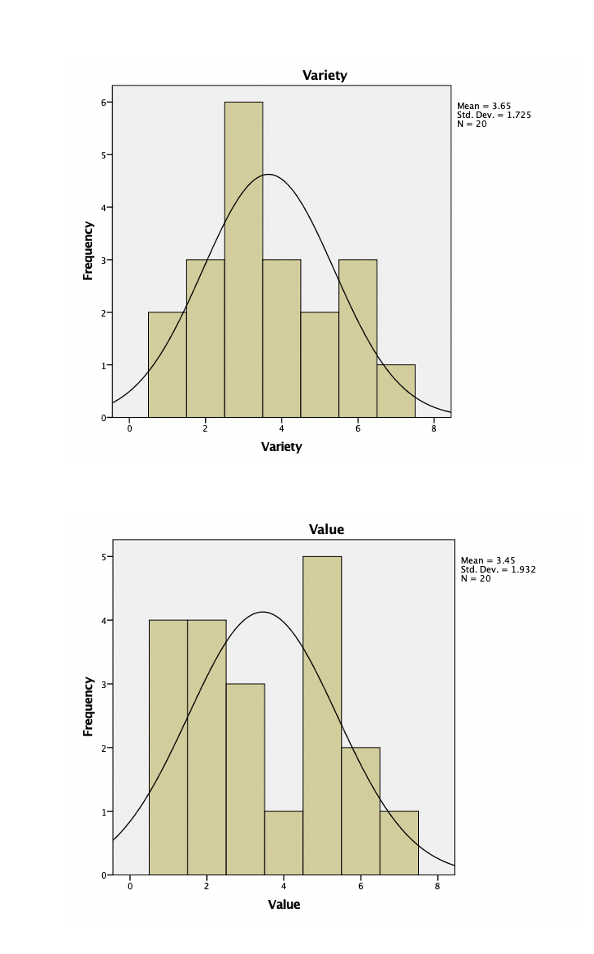
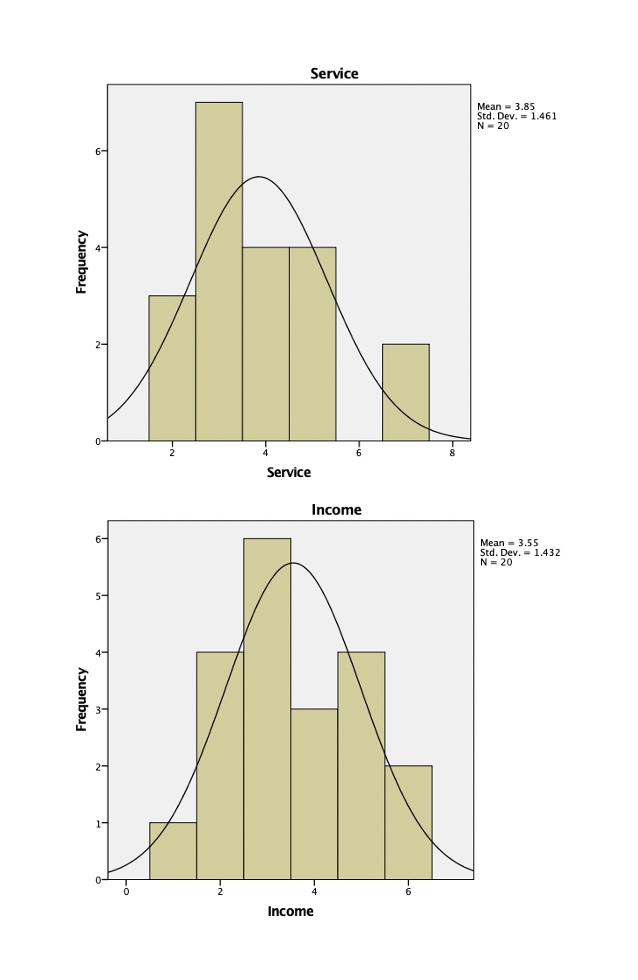
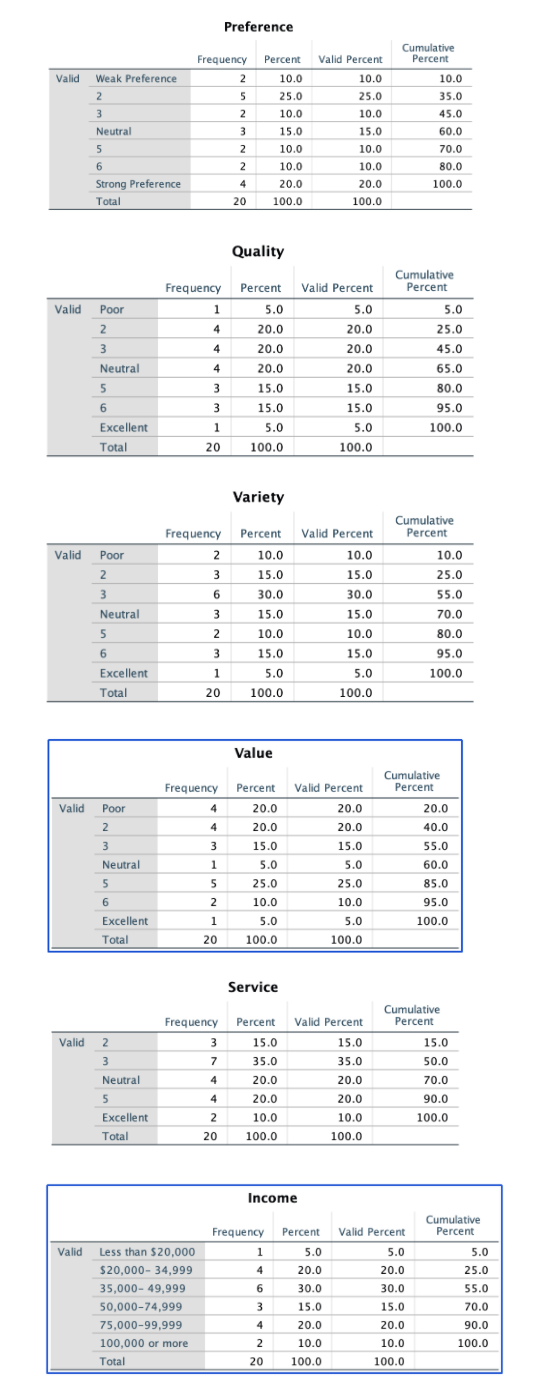
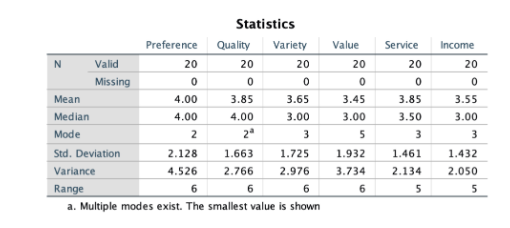
\f\f\fPreference Cumulative Frequency Percent Valid Percent Percent Valid Weak Preference 2 10.0 10.0 10.0 2 5 25.0 25.0 35.0 3 2 10.0 10.0 45.0 Neutral 3 15.0 15.0 60.0 5 2 10.0 10.0 70.0 6 2 10.0 10.0 80.0 Strong Preference 4 20.0 20.0 100.0 Total 20 100.0 100.0 Quality Cumulative Frequency Percent Valid Percent Percent Valid Poor 1 5.0 5.0 5.0 2 20.0 20.0 25.0 3 20.0 20.0 45.0 Neutral 20.0 20.0 65.0 5 W 15.0 15.0 80.0 6 w 15.0 15.0 95.0 Excellent 5.0 5.0 100.0 Total 20 100.0 100.0 Variety Cumulative Frequency Percent Valid Percent Percent Valid Poor IN 10.0 10.0 10.0 3 15.0 15.0 25.0 30.0 30.0 55.0 Neutral 3 15.0 15.0 70.0 5 10.0 10.0 80.0 6 H W N 15.0 15.0 95.0 Excellent 5.0 5.0 100.0 Total 20 100.0 100.0 Value Cumulative Frequency Percent Valid Percent Percent Valid Poor 20.0 20.0 20.0 2 20.0 20.0 40.0 3 3 15.0 15.0 55.0 Neutral 5.0 5.0 60.0 5 25.0 25.0 85.0 6 2 10.0 10.0 95.0 Excellent 1 5.0 5.0 100.0 Total 20 100.0 100.0 Service Cumulative Frequency Percent Valid Percent Percent Valid 2 3 15.0 15.0 15.0 3 35.0 35.0 50.0 Neutral 20.0 20.0 70.0 5 20.0 20.0 90.0 Excellent 2 10.0 10.0 100.0 Total 20 100.0 100.0 Income Cumulative Frequency Percent Valid Percent Percent Valid Less than $20,000 5.0 5.0 5.0 $20,000- 34,999 20.0 20.0 25.0 35,000-49,999 30.0 30.0 55.0 50,000-74,999 W 15.0 15.0 70.0 75,000-99,999 20.0 20.0 90.0 100,000 or more 2 10.0 10.0 100.0 Total 20 100.0 100.0Statistics Preference Quality Variety Value Service Income N Valid 20 20 20 20 20 20 Missing 0 0 0 0 0 Mean 4.00 3.85 3.65 3.45 3.85 3.55 Median 4.00 4.00 3.00 3.00 3.50 3.00 Mode 2 3 5 3 Std. Deviation 2.128 1.663 1.725 1.932 1.461 1.432 Variance 4.526 2.766 2.976 3.734 2.134 2.050 Range 6 6 6 6 5 5 a. Multiple modes exist. The smallest value is shown
Step by Step Solution
There are 3 Steps involved in it

Get step-by-step solutions from verified subject matter experts