

Question: Fig, 1 Decision Tree Analysis [success = benefits, failure = costs, and P= probability] 8-1] [10] Using the Decision Tree of Fig.1, find the expected
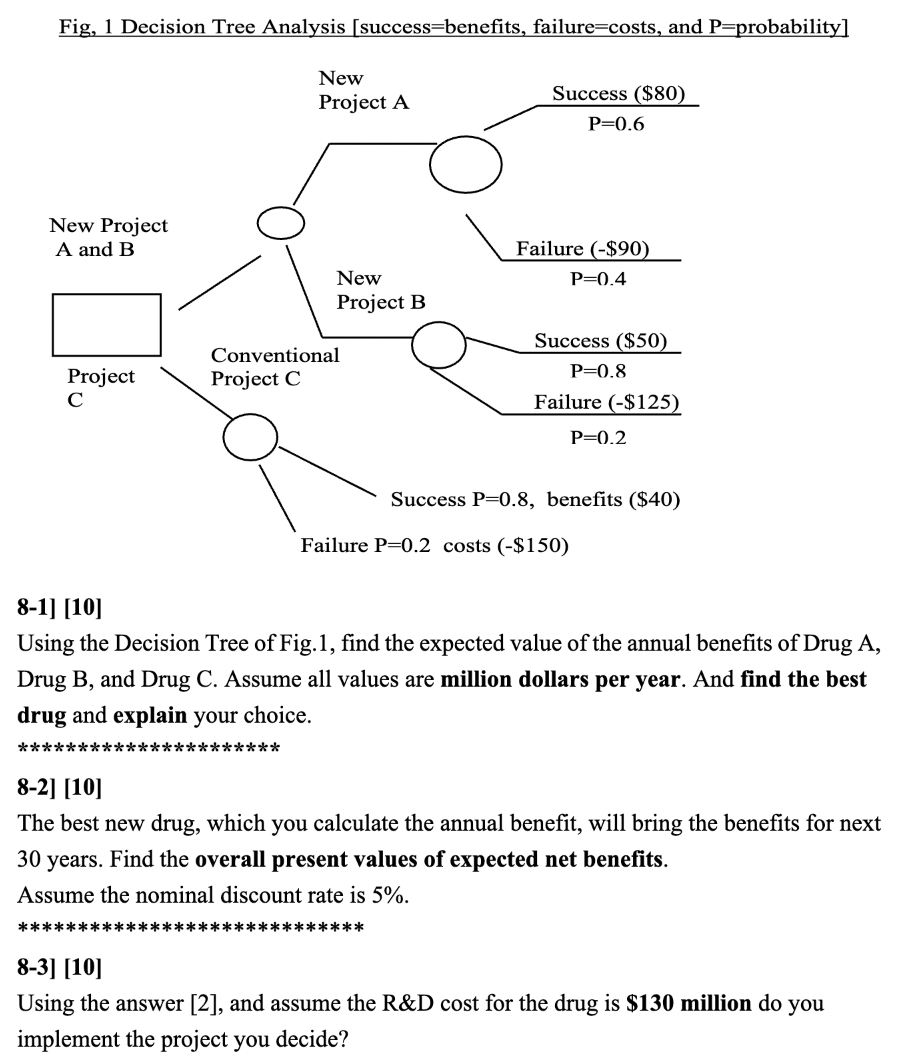
Fig, 1 Decision Tree Analysis [success = benefits, failure = costs, and P= probability] 8-1] [10] Using the Decision Tree of Fig.1, find the expected value of the annual benefits of Drug A, Drug B, and Drug C. Assume all values are million dollars per year. And find the best drug and explain your choice. 8-2] [10] The best new drug, which you calculate the annual benefit, will bring the benefits for next 30 years. Find the overall present values of expected net benefits. Assume the nominal discount rate is 5%. 8-3] [10] Using the answer [2], and assume the R\&D cost for the drug is $130 million do you implement the project you decide? Fig, 1 Decision Tree Analysis [success = benefits, failure = costs, and P= probability] 8-1] [10] Using the Decision Tree of Fig.1, find the expected value of the annual benefits of Drug A, Drug B, and Drug C. Assume all values are million dollars per year. And find the best drug and explain your choice. 8-2] [10] The best new drug, which you calculate the annual benefit, will bring the benefits for next 30 years. Find the overall present values of expected net benefits. Assume the nominal discount rate is 5%. 8-3] [10] Using the answer [2], and assume the R\&D cost for the drug is $130 million do you implement the project you decide
Step by Step Solution
There are 3 Steps involved in it

Get step-by-step solutions from verified subject matter experts