

Question: Please show your formulas so I can learn how to complete this excel properly. Thank you! Chapter 26. Ch 26-9 Build a Model Bradford Services
 Please show your formulas so I can learn how to complete this excel properly. Thank you!
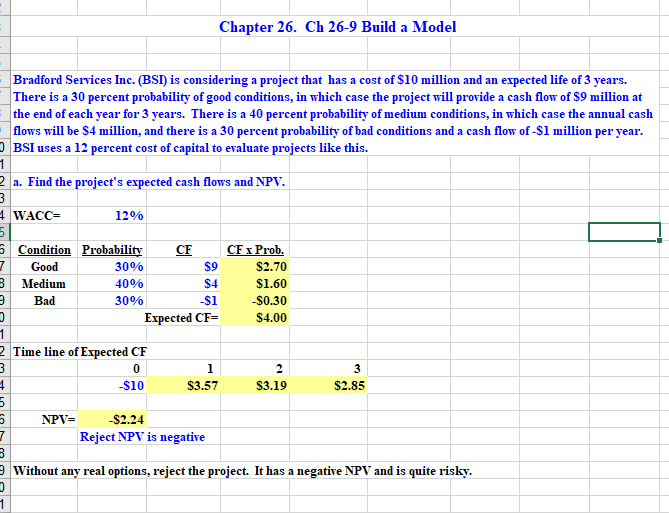
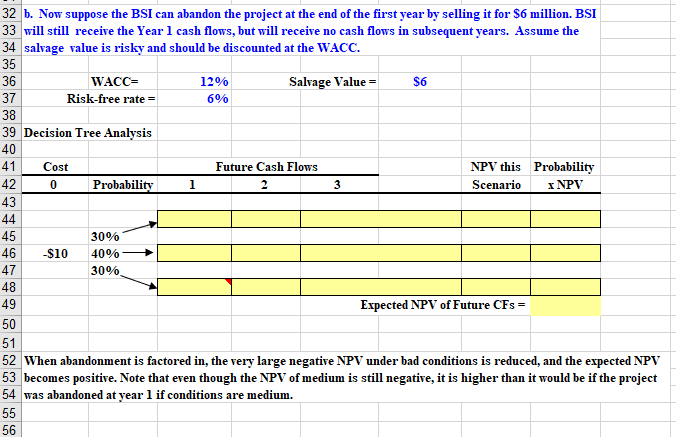
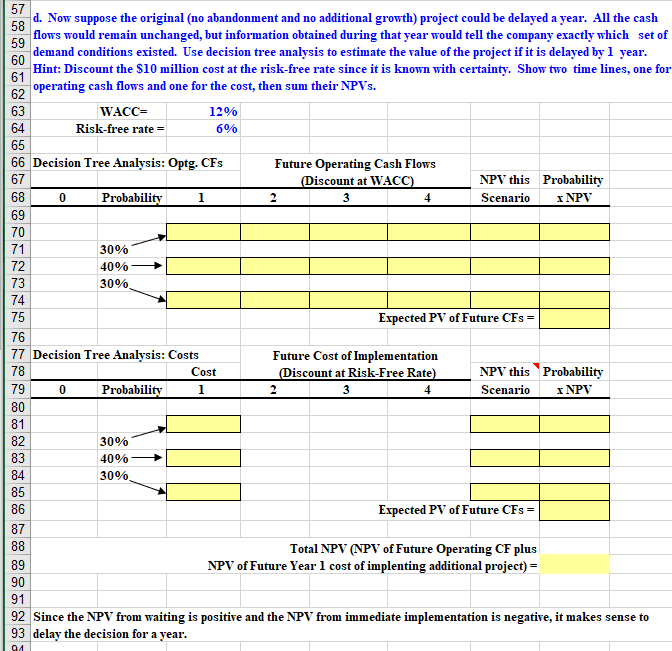
Chapter 26. Ch 26-9 Build a Model Bradford Services Inc. (BSI) is considering a project that has a cost of $10 million and an expected life of 3 years. There is a 30 percent probability of good conditions, in which case the project will provide a cash flow of $9 million at the end of each year for 3 years. There is a 40 percent probability of medium conditions, in which case the annual cash flows will be $4 million, and there is a 30 percent probability of bad conditions and a cash flow of -$1 million per year. BSI uses a 12 percent cost of capital to evaluate projects like this. 1 2 a. Find the project's expected cash flows and NPV. 3 4 WACC= 12% 5 6 Condition Probability CF CF x Prob. 7 Good 30% $9 $2.70 3 Medium 40% $4 $1.60 3 Bad 30% -$1 -$0.30 3 Expected CF- $4.00 1. 2 Time line of Expected CF 3 0 1 2 $10 $3.57 $3.19 $2.85 5 5 NPV= $2.24 7 Reject NPV is negative 3 9 Without any real options, reject the project. It has a negative NPV and is quite risky. 3 1 3 1 32 b. Now suppose the BSI can abandon the project at the end of the first year by selling it for $6 million. BSI 33 will still receive the Year 1 cash flows, but will receive no cash flows in subsequent years. Assume the 34 salvage value is risky and should be discounted at the WACC. 35 36 WACC= 12% Salvage Value = $6 37 Risk-free rate = 6% 38 39 Decision Tree Analysis 40 41 Cost Future Cash Flows NPV this Probability 42 0 Probability 2 3 Scenario X NPV 43 44 45 30% 46 $10 40% 47 30% 48 49 Expected NPV of Future CFs = 50 51 52 When abandonment is factored in, the very large negative NPV under bad conditions is reduced, and the expected NPV 53 becomes positive. Note that even though the NPV of medium is still negative, it is higher than it would be if the project 54 was abandoned at year 1 if conditions are medium. 55 56 0 4 57 58 d. Now suppose the original (no abandonment and no additional growth) project could be delayed a year. All the cash 59 flows would remain unchanged, but information obtained during that year would tell the company exactly which set of demand conditions existed. Use decision tree analysis to estimate the value of the project if it is delayed by 1 year. 60 Hint: Discount the $10 million cost at the risk-free rate since it is known with certainty. Show two time lines, one for 61 62 operating cash flows and one for the cost, then sum their NPVs. 63 WACC= 12% 64 Risk-free rate 6% 65 66 Decision Tree Analysis: Optg. CFs Future Operating Cash Flows 67 (Discount at WACC) NPV this Probability 68 Probability 1 2 3 Scenario X NPV 69 70 71 30% 72 40% 73 30% 74 75 Expected PV of Future CFs = 76 77 Decision Tree Analysis: Costs Future Cost of Implementation 78 Cost (Discount at Risk-Free Rate) NPV this Probability 79 Probability 1 2 3 4 Scenario X NPV 80 81 82 30% 83 40% 84 30% 85 86 Expected PV of Future CFs = 87 88 Total NPV (NPV of Future Operating CF plus 89 NPV of Future Year 1 cost of implenting additional project) = 90 91 92 Since the NPV from waiting is positive and the NPV from immediate implementation is negative, it makes sense to 93 delay the decision for a year. 0 91 Chapter 26. Ch 26-9 Build a Model Bradford Services Inc. (BSI) is considering a project that has a cost of $10 million and an expected life of 3 years. There is a 30 percent probability of good conditions, in which case the project will provide a cash flow of $9 million at the end of each year for 3 years. There is a 40 percent probability of medium conditions, in which case the annual cash flows will be $4 million, and there is a 30 percent probability of bad conditions and a cash flow of -$1 million per year. BSI uses a 12 percent cost of capital to evaluate projects like this. 1 2 a. Find the project's expected cash flows and NPV. 3 4 WACC= 12% 5 6 Condition Probability CF CF x Prob. 7 Good 30% $9 $2.70 3 Medium 40% $4 $1.60 3 Bad 30% -$1 -$0.30 3 Expected CF- $4.00 1. 2 Time line of Expected CF 3 0 1 2 $10 $3.57 $3.19 $2.85 5 5 NPV= $2.24 7 Reject NPV is negative 3 9 Without any real options, reject the project. It has a negative NPV and is quite risky. 3 1 3 1 32 b. Now suppose the BSI can abandon the project at the end of the first year by selling it for $6 million. BSI 33 will still receive the Year 1 cash flows, but will receive no cash flows in subsequent years. Assume the 34 salvage value is risky and should be discounted at the WACC. 35 36 WACC= 12% Salvage Value = $6 37 Risk-free rate = 6% 38 39 Decision Tree Analysis 40 41 Cost Future Cash Flows NPV this Probability 42 0 Probability 2 3 Scenario X NPV 43 44 45 30% 46 $10 40% 47 30% 48 49 Expected NPV of Future CFs = 50 51 52 When abandonment is factored in, the very large negative NPV under bad conditions is reduced, and the expected NPV 53 becomes positive. Note that even though the NPV of medium is still negative, it is higher than it would be if the project 54 was abandoned at year 1 if conditions are medium. 55 56 0 4 57 58 d. Now suppose the original (no abandonment and no additional growth) project could be delayed a year. All the cash 59 flows would remain unchanged, but information obtained during that year would tell the company exactly which set of demand conditions existed. Use decision tree analysis to estimate the value of the project if it is delayed by 1 year. 60 Hint: Discount the $10 million cost at the risk-free rate since it is known with certainty. Show two time lines, one for 61 62 operating cash flows and one for the cost, then sum their NPVs. 63 WACC= 12% 64 Risk-free rate 6% 65 66 Decision Tree Analysis: Optg. CFs Future Operating Cash Flows 67 (Discount at WACC) NPV this Probability 68 Probability 1 2 3 Scenario X NPV 69 70 71 30% 72 40% 73 30% 74 75 Expected PV of Future CFs = 76 77 Decision Tree Analysis: Costs Future Cost of Implementation 78 Cost (Discount at Risk-Free Rate) NPV this Probability 79 Probability 1 2 3 4 Scenario X NPV 80 81 82 30% 83 40% 84 30% 85 86 Expected PV of Future CFs = 87 88 Total NPV (NPV of Future Operating CF plus 89 NPV of Future Year 1 cost of implenting additional project) = 90 91 92 Since the NPV from waiting is positive and the NPV from immediate implementation is negative, it makes sense to 93 delay the decision for a year. 0 91
Step by Step Solution
There are 3 Steps involved in it

Get step-by-step solutions from verified subject matter experts