

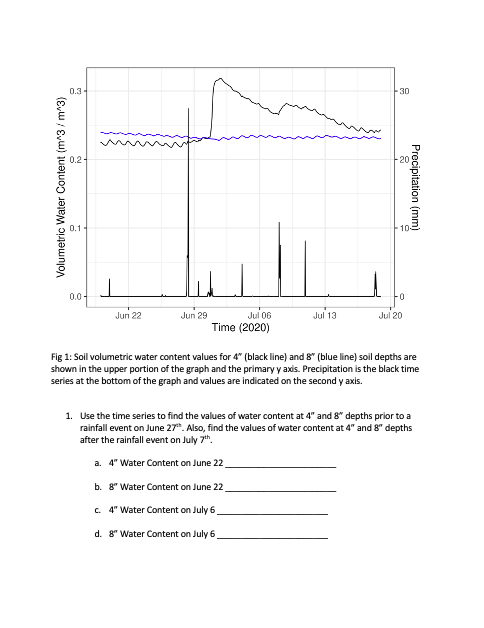
Question: Fig 1 : Soil volumetric water content values for 4 ( black line ) and 8 ( blue line ) soil depths are
Fig : Soil volumetric water content values for black line and blue line soil depths are
shown in the upper portion of the graph and the primary y axis. Precipitation is the black time
series at the bottom of the graph and values are indicated on the second y axis.
Use the time series to find the values of water content at and depths prior to a
rainfall event on June Also, find the values of water content at and depths
after the rainfall event on July
a Water Content on June
b Water Content on June
c Water Content on July
d Water Content on July
Step by Step Solution
There are 3 Steps involved in it
1 Expert Approved Answer
Step: 1 Unlock

Question Has Been Solved by an Expert!
Get step-by-step solutions from verified subject matter experts
Step: 2 Unlock
Step: 3 Unlock