

Question: FIG 1.19 1- For this problem, use the table in figure 1.19. Assume two identical computers A and B. Computer A targets a workload from
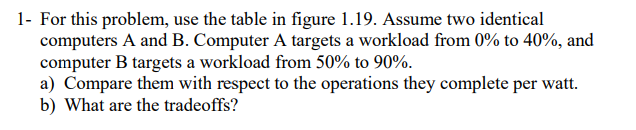
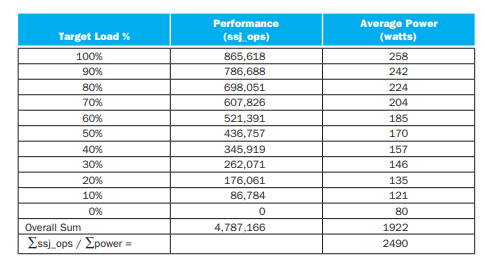
FIG 1.19
1- For this problem, use the table in figure 1.19. Assume two identical computers A and B. Computer A targets a workload from 0% to 40%, and computer B targets a workload from 50% to 90%. a) Compare them with respect to the operations they complete per watt. b) What are the tradeoffs? Performance (ssj_ops) Average Power (watts) Target Load % 100% 90% 80% 70% 60% 50% 40% 30% 20% 10% 0% Overall Sum | ssi_ops / ower 865,618 786,688 698,051 607,826 521,391 436,757 345,919 262,071 176,061 86,784 0 4,787,166 258 242 224 204 185 170 157 146 135 121 80 1922 2490
Step by Step Solution
There are 3 Steps involved in it
1 Expert Approved Answer
Step: 1 Unlock

Question Has Been Solved by an Expert!
Get step-by-step solutions from verified subject matter experts
Step: 2 Unlock
Step: 3 Unlock