

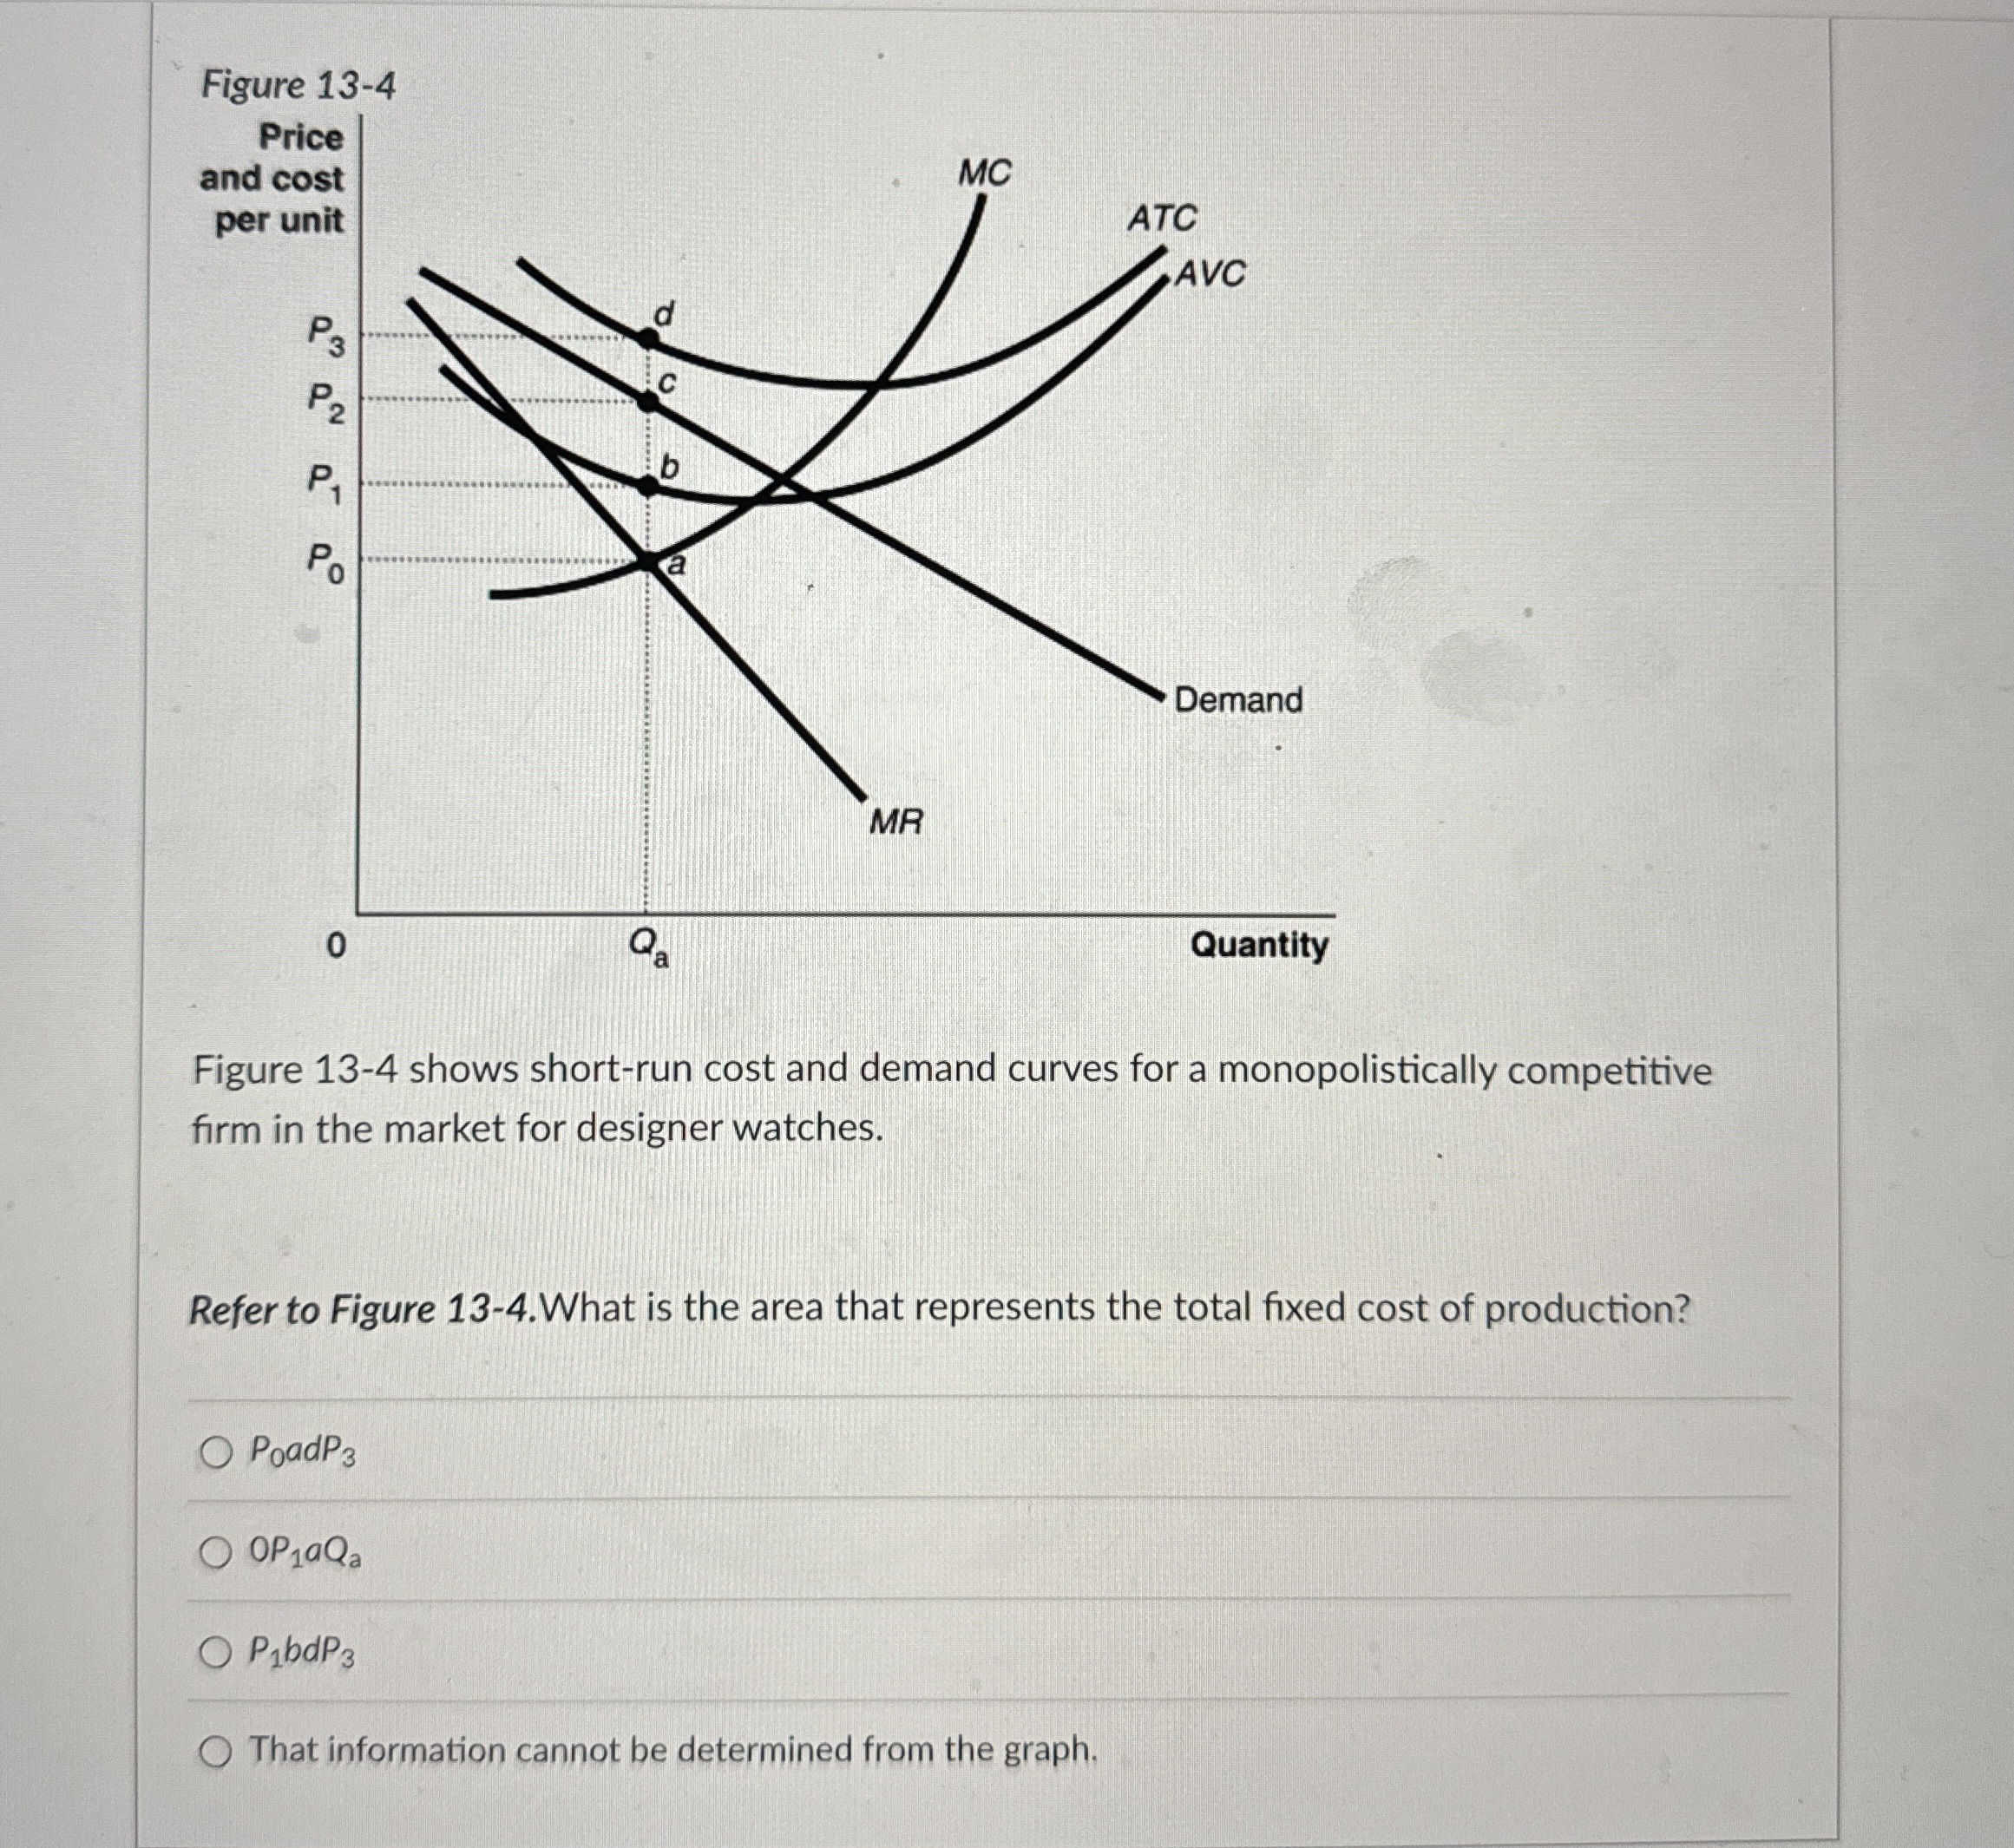
Question: Figure 1 3 - 4 shows short - run cost and demand curves for a monopolistically competitive firm in the market for designer watches. Refer
Figure shows shortrun cost and demand curves for a monopolistically competitive firm in the market for designer watches.
Refer to Figure What is the area that represents the total fixed cost of production?
That information cannot be determined from the graph.
Step by Step Solution
There are 3 Steps involved in it
1 Expert Approved Answer
Step: 1 Unlock

Question Has Been Solved by an Expert!
Get step-by-step solutions from verified subject matter experts
Step: 2 Unlock
Step: 3 Unlock