

Question: Figure 1 Figure 2. Data for block X Block X Velocity (m/s) Time (s 50 40 30 Velocity (m/s) DO Time (s Figure 3. Data


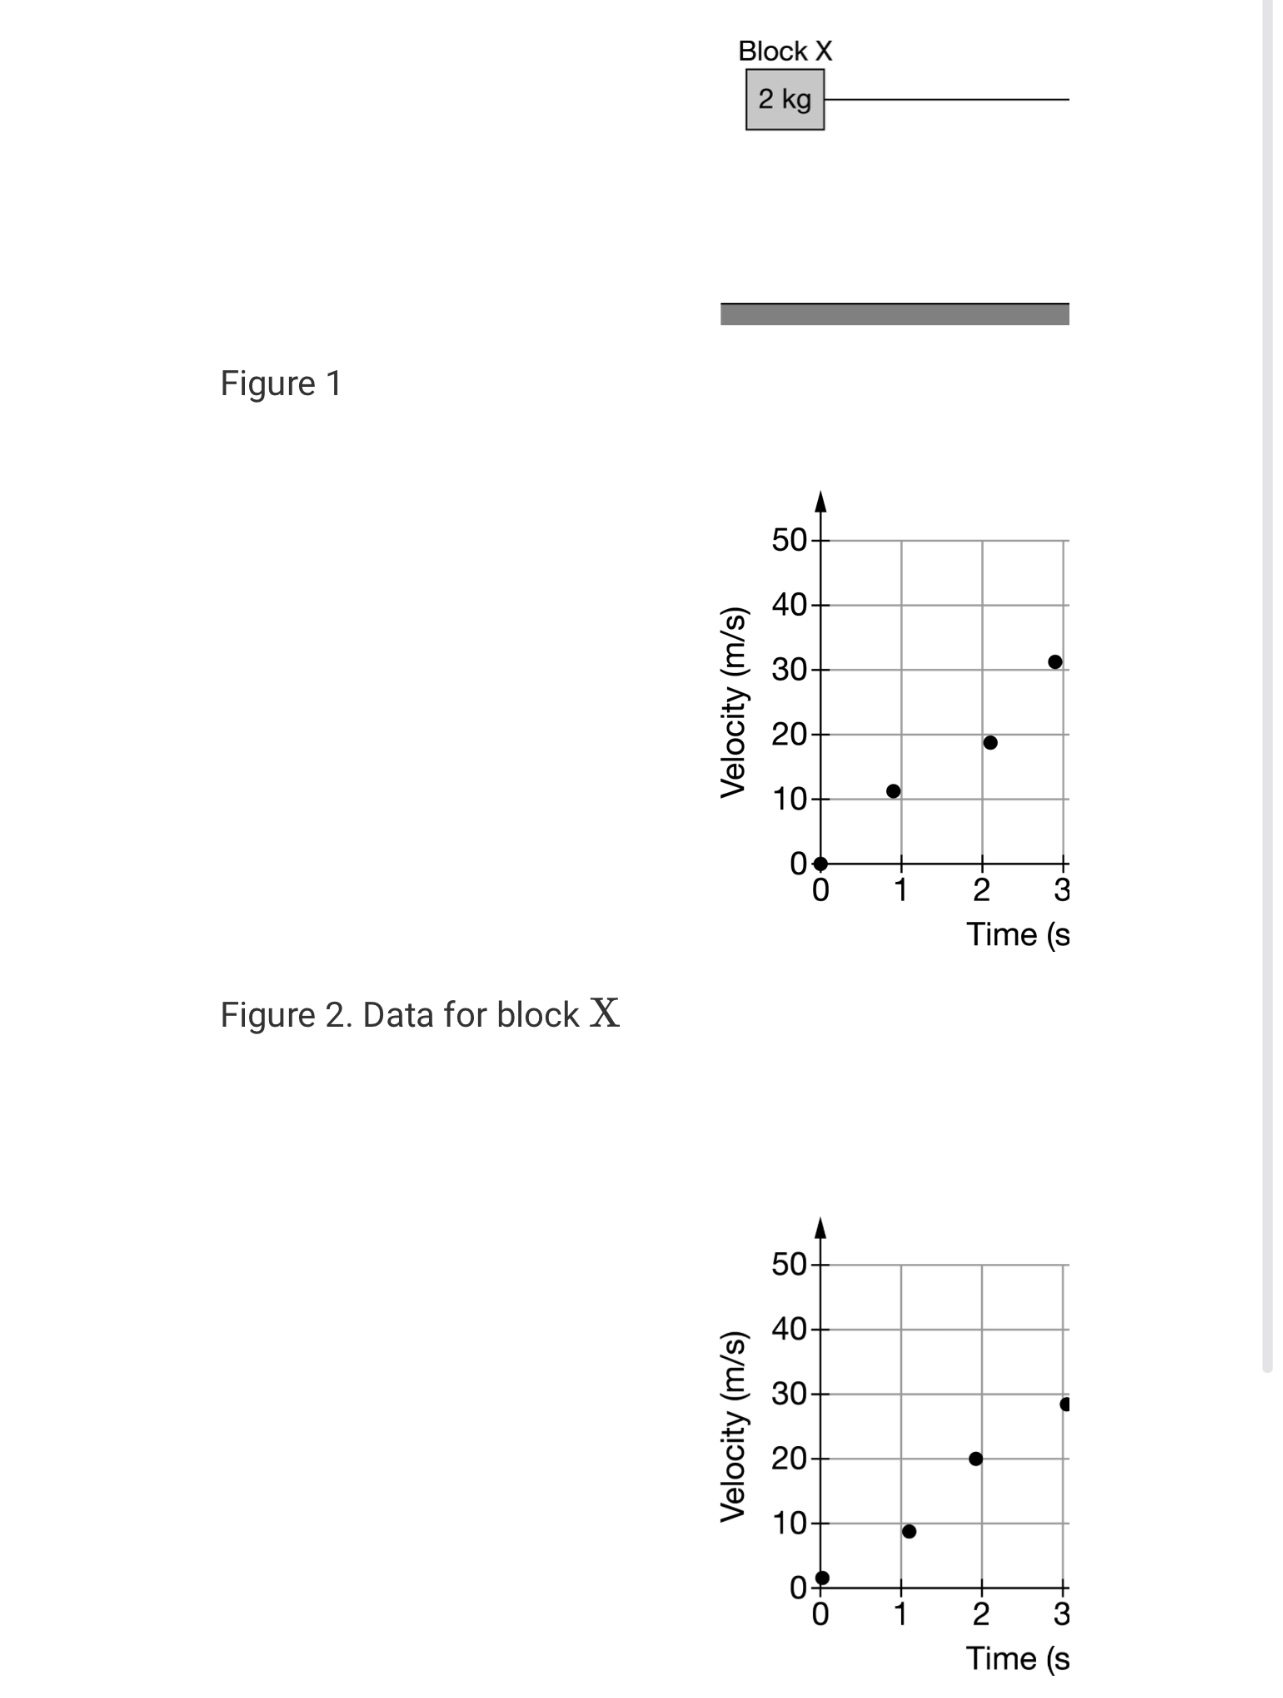
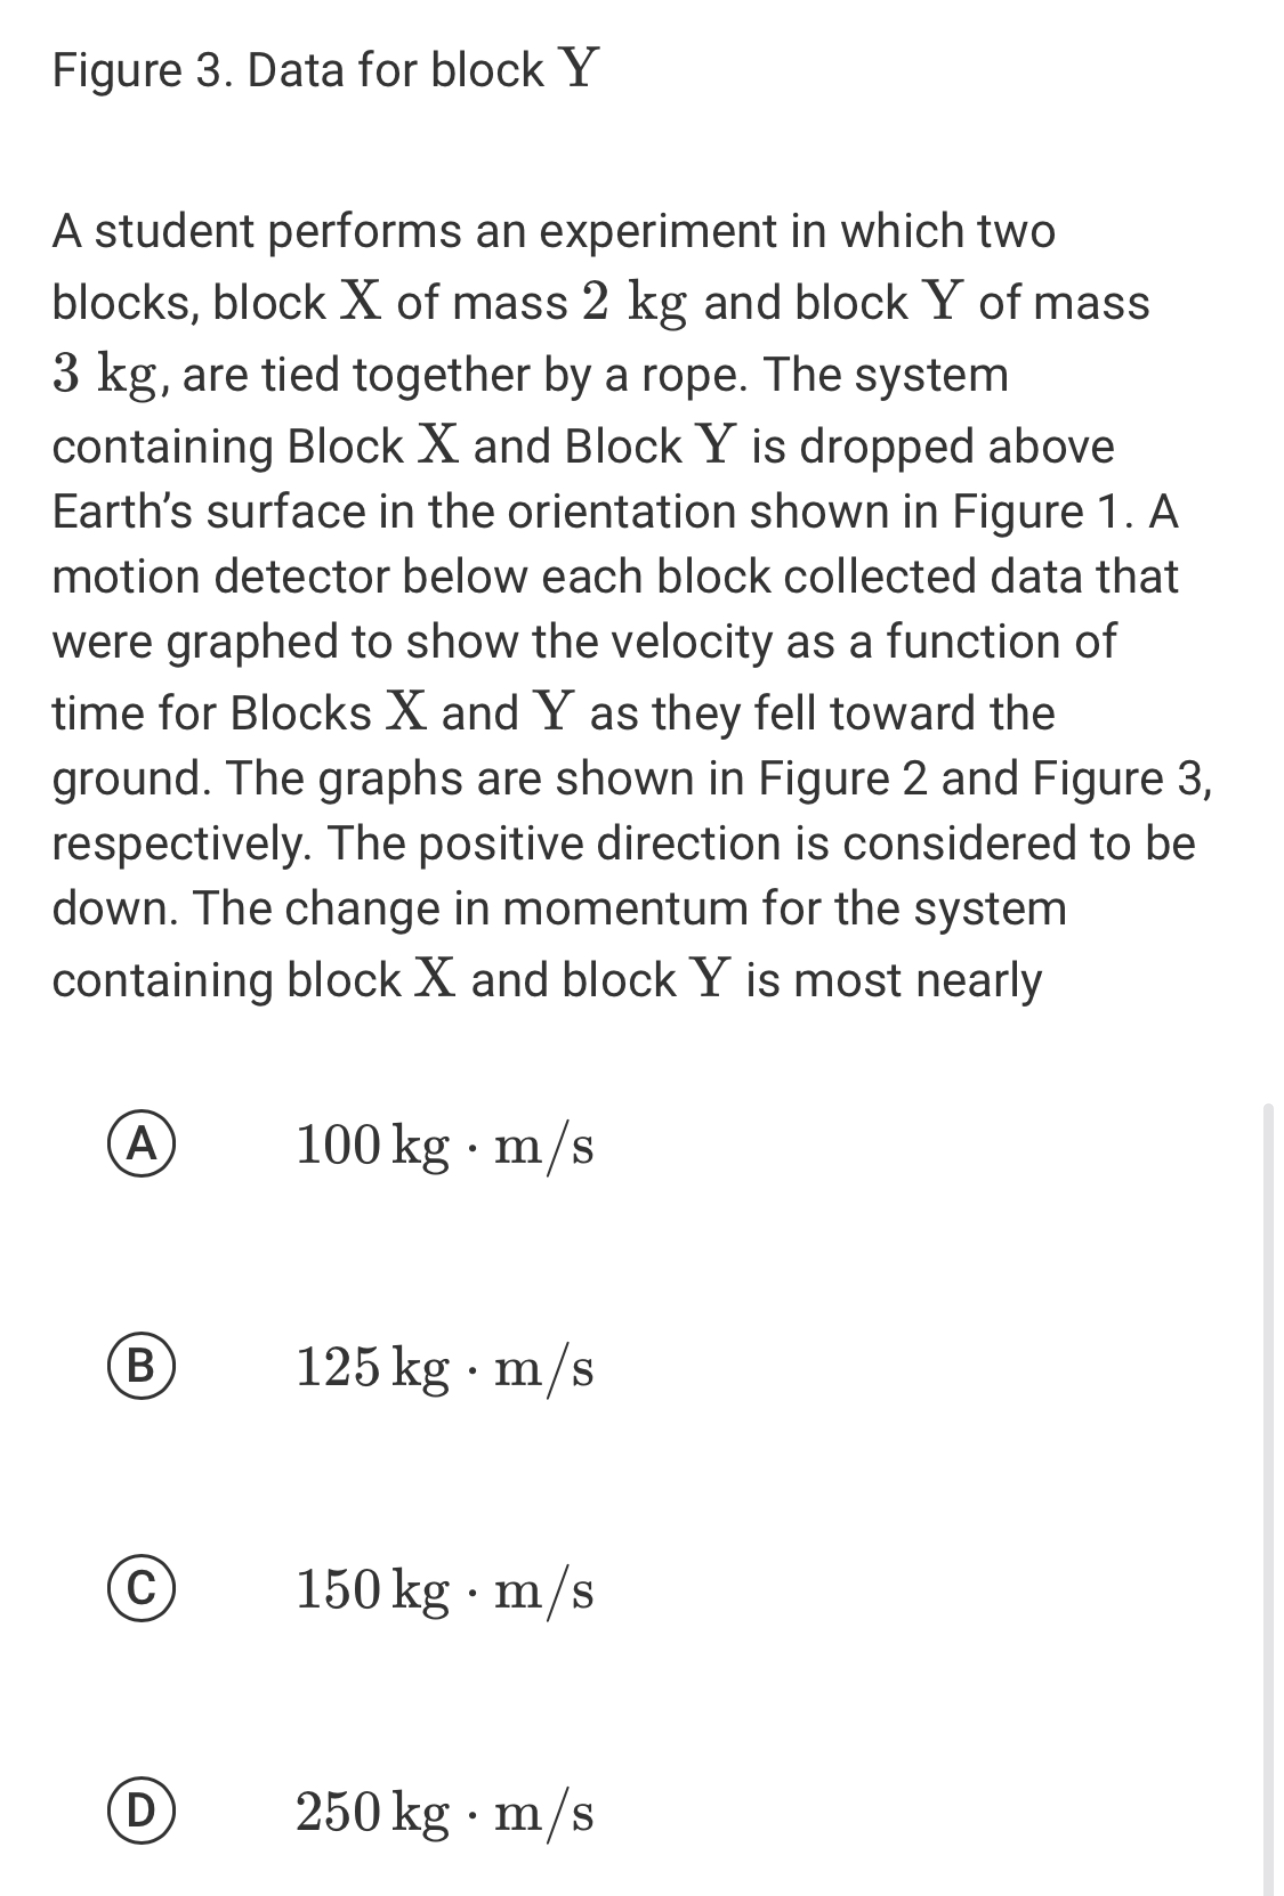
Figure 1 Figure 2. Data for block X Block X Velocity (m/s) Time (s 50 40 30 Velocity (m/s) DO Time (s Figure 3. Data for block Y A student performs an experiment in which two blocks, block X of mass 2 kg and block Y of mass 3 kg, are tied together by a rope. The system containing Block X and Block Y is dropped above Earth's surface in the orientation shown in Figure 1. A motion detector below each block collected data that were graphed to show the velocity as a function of time for Blocks X and Y as they fell toward the ground. The graphs are shown in Figure 2 and Figure 3, respectively. The positive direction is considered to be down. The change in momentum for the system containing block X and block Y is most nearly A 100 kg . m/s B 125 kg . m/s C 150 kg . m/s D 250 kg . m/s
Step by Step Solution
There are 3 Steps involved in it

Get step-by-step solutions from verified subject matter experts