

Question: Figure 1 Given: Using differential leveling, BM A ( 1 0 5 8 . 3 9 ft elevation ) was run to BM B in
Figure
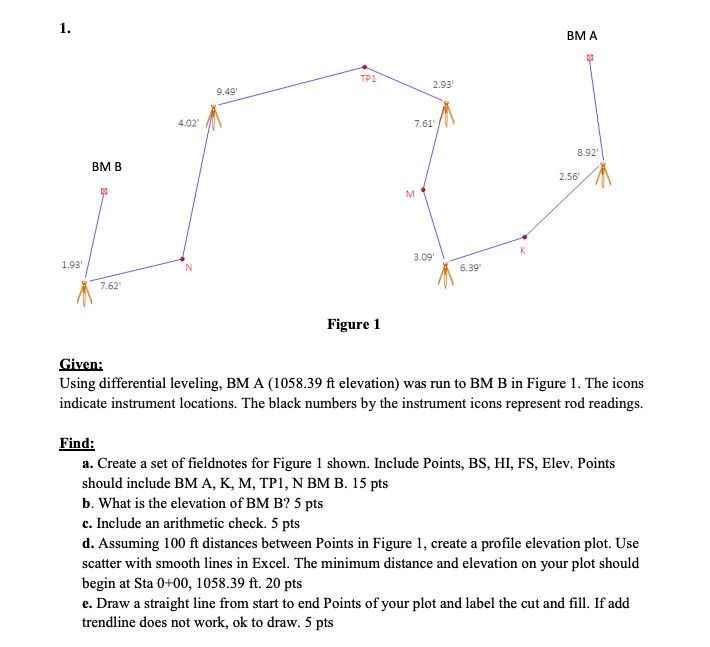
Given:
Using differential leveling, BM A ft elevation was run to BM B in Figure The icons indicate instrument locations. The black numbers by the instrument icons represent rod readings.
Find:
a Create a set of fieldnotes for Figure shown. Include Points, BS HI FS Elev. Points should include BM A K M TP N BM B pts
b What is the elevation of BM B pts
c Include an arithmetic check. pts
d Assuming ft distances between Points in Figure create a profile elevation plot. Use scatter with smooth lines in Excel. The minimum distance and elevation on your plot should begin at Sta mathrmft
e Draw a straight line from start to end Points of your plot and label the cut and fill. If add trendline does not work, ok to draw. pts
Step by Step Solution
There are 3 Steps involved in it
1 Expert Approved Answer
Step: 1 Unlock

Question Has Been Solved by an Expert!
Get step-by-step solutions from verified subject matter experts
Step: 2 Unlock
Step: 3 Unlock